Sunbeam 2004 Annual Report Download - page 16
Download and view the complete annual report
Please find page 16 of the 2004 Sunbeam annual report below. You can navigate through the pages in the report by either clicking on the pages listed below, or by using the keyword search tool below to find specific information within the annual report.-
 1
1 -
2
-
3
-
4
-
5
-
 6
6 -
 7
7 -
 8
8 -
 9
9 -
 10
10 -
 11
11 -
 12
12 -
 13
13 -
 14
14 -
 15
15 -
 16
16 -
 17
17 -
 18
18 -
 19
19 -
 20
20 -
 21
21 -
 22
22 -
 23
23 -
 24
24 -
 25
25 -
 26
26 -
27
-
28
-
29
-
30
-
31
-
32
-
33
-
34
-
35
-
36
-
37
-
38
-
39
-
40
-
41
-
42
-
43
-
44
-
45
-
46
-
47
-
48
-
49
-
50
-
51
-
52
-
53
-
54
-
55
-
56
-
57
-
58
-
59
-
60
-
61
-
62
-
63
-
64
-
65
-
66
-
67
-
68
-
69
-
70
-
71
-
72
-
73
-
74
-
75
-
76
-
77
-
78
 |
 |
Management’s Discussion and Analysis of Financial Condition and Results of Operations
The following “Overview” section is a brief summary of the significant issues addressed in Management’s
Discussion and Analysis of Financial Condition and Results of Operations (“MD&A”). Investors should read the
relevant sections of this MD&A for a complete discussion of the issues summarized below. The entire MD&A should
be read in conjunction with Item 6., Selected Financial Data and Item 8., Financial Statements and Supplementary
Data appearing elsewhere in this Form 10-K.
Overview
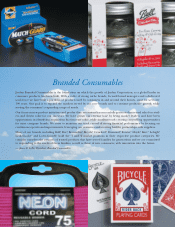
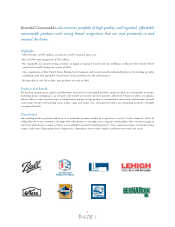
We are a leading provider of market leading branded consumer products used in and around the
home, marketed under well-known brand names including Ball®, Bee®, Bicycle®, Crawford®, Diamond®,
FoodSaver®, Forster®, Hoyle®, Kerr®, Lehigh®, Leslie-Locke®, Loew-Cornell®and VillaWare®. As a result
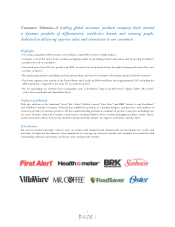
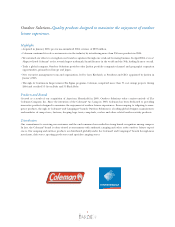
of our acquisition of American Household, Inc. (“AHI”) on January 24, 2005 (“AHI Acquisition”)we
also provide global consumer products through the Campingaz®, Coleman®, First Alert®, Health o
meter®, Mr. Coffee®, Oster®and Sunbeam®brands (see “Recent Developments”). See Item 1. Business
and Note 5. Business Segment Information in Item 8. Financial Statements and Supplementary Data,
both included herein, for a discussion of each of our segment’s products.
Results of Operations
‰Our net sales increased by $251.0 million in 2004 or, in percentage terms, by 42.7% over 2003;
‰Our operating income increased from $71.5 million in 2003 to $96.1 million in 2004 or, in
percentage terms, by 34.5% over the prior year. Such increase was after non-cash restricted stock
charges in 2004 and 2003 of $32.4 million and $21.8 million, respectively, which had the effect
of reducing our operating income reported under generally accepted accounting principles in
the United States (“GAAP”) in both years;
‰Our net income increased from $31.8 million in 2003 to $42.4 million in 2004 or, in percentage
terms, by 33.5% over the prior year. Such increase was after non-cash restricted stock charges,
net of related tax benefits, in 2004 and 2003 of $20.0 million and $13.3 million, respectively,
which had the effect of reducing our net income reported under GAAP in both years;
‰Our diluted earnings per share increased from $1.35 in 2003 to $1.49 in 2004 or, in percentage
terms, by 10.4% over the prior year. Given our diluted weighted average shares outstanding in
2004 and 2003 of 28.5 million and 23.5 million, respectively, the effect of the non-cash restricted
stock charges discussed above was to reduce our diluted earnings per share amounts reported
under GAAP by $0.71 and $0.56 in 2004 and 2003, respectively; and
‰The increases to our net sales, operating income, net income and diluted earnings per share
discussed above, are principally the result of acquisitions we completed in 2004 and 2003, which
are described in “Acquisition Activities” below. In addition, on an overall basis we had organic
growth of approximately 5% in 2004.
Liquidity and Capital Resources
‰In taking advantage of cash on hand to partially fund the acquisitions of Bicycle Holding, Inc.
and its wholly-owned subsidiary United States Playing Card Company (collectively “USPC” and
“USPC Acquisition”) and to fund the acquisition of Loew-Cornell, Inc. (“Loew-Cornell” and
“Loew-Cornell Acquisition”), our liquidity, as measured by cash and cash equivalents on hand
and availability under our debt facility was lower at December 31, 2004 than at December 31,
2003;
‰We ended 2004 with a lower net debt-to-total capitalization ratio than as of December 31, 2003
due to a significant increase in our market capitalization, which was only partially offset by the
additional debt incurred to partially fund the USPC Acquisition;
14