Southwest Airlines 2015 Annual Report Download - page 11
Download and view the complete annual report
Please find page 11 of the 2015 Southwest Airlines annual report below. You can navigate through the pages in the report by either clicking on the pages listed below, or by using the keyword search tool below to find specific information within the annual report.-
 1
1 -
 2
2 -
 3
3 -
 4
4 -
 5
5 -
 6
6 -
 7
7 -
 8
8 -
 9
9 -
 10
10 -
 11
11 -
 12
12 -
 13
13 -
 14
14 -
 15
15 -
 16
16 -
 17
17 -
 18
18 -
 19
19 -
 20
20 -
 21
21 -
 22
22 -
23
-
24
-
25
-
26
-
27
-
28
-
29
-
30
-
31
-
32
-
33
-
34
-
35
-
36
-
37
-
38
-
39
-
40
-
41
-
42
-
43
-
44
-
45
-
46
-
47
-
48
-
49
-
50
-
51
-
52
-
53
-
54
-
55
-
56
-
57
-
58
-
59
-
60
-
61
-
62
-
63
-
64
-
65
-
66
-
67
-
68
-
69
-
70
-
71
-
72
-
73
-
74
-
75
-
76
-
77
-
78
-
79
-
80
-
81
-
82
-
83
-
84
-
85
-
86
-
87
-
88
-
89
-
90
-
91
-
92
-
93
-
94
-
95
-
96
-
97
-
98
-
99
-
100
-
101
-
102
-
103
-
104
-
105
-
106
-
107
-
108
-
109
-
110
-
111
-
112
-
113
-
114
-
115
-
116
-
117
-
118
-
119
-
120
-
121
-
122
-
123
-
124
-
125
-
126
-
127
-
128
-
129
-
130
-
131
-
132
-
133
-
134
-
135
-
136
-
137
-
138
-
139
-
140
-
141
-
142
-
143
-
144
-
145
-
146
-
147
-
148
 |
 |

Cost Structure
General
A key component of the Company’s business strategy has historically been its low-cost structure,
which was designed to allow it to profitably charge low fares. Adjusted for stage length, the Company
has lower unit costs, on average, than the majority of major domestic carriers. The Company’s low-
cost structure has historically been facilitated by Southwest’s use of a single aircraft type, the Boeing
737, its operationally efficient point-to-point route structure, and its highly productive Employees.
Southwest’s use of a single aircraft type has allowed for simplified scheduling, maintenance, flight
operations, and training activities. Southwest’s point-to-point route structure includes service to and
from many secondary or downtown airports such as Dallas Love Field, Houston Hobby, Chicago
Midway, Baltimore-Washington International, Burbank, Manchester, Oakland, San Jose, Providence,
and Ft. Lauderdale-Hollywood. These conveniently located airports are typically less congested than
other airlines’ hub airports, which has contributed to Southwest’s ability to achieve high asset
utilization because aircraft can be scheduled to minimize the amount of time they are on the ground.
This, in turn, has reduced the number of aircraft and gate facilities that would otherwise be required
and allows for high Employee productivity (headcount per aircraft).
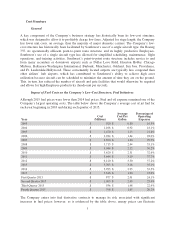
Impact of Fuel Costs on the Company’s Low-Cost Structure; Fuel Initiatives
Although 2015 fuel prices were lower than 2014 fuel prices, Fuel and oil expense remained one of the
Company’s largest operating costs. The table below shows the Company’s average cost of jet fuel for
each year beginning in 2003 and during each quarter of 2015.
Year
Cost
(Millions)
Average
Cost Per
Gallon
Percentage of
Operating
Expenses
2003 $ 920 $ 0.80 16.5%
2004 $ 1,106 $ 0.92 18.1%
2005 $ 1,470 $ 1.13 21.4%
2006 $ 2,284 $ 1.64 28.0%
2007 $ 2,690 $ 1.80 29.7%
2008 $ 3,713 $ 2.44 35.1%
2009 $ 3,044 $ 2.12 30.2%
2010 $ 3,620 $ 2.51 32.6%
2011 $ 5,644 $ 3.19 37.7%
2012 $ 6,120 $ 3.30 37.2%
2013 $ 5,763 $ 3.16 35.1%
2014 $ 5,293 $ 2.93 32.3%
2015 $ 3,616 $ 1.90 23.0%
First Quarter 2015 $ 877 $ 2.01 24.1%
Second Quarter 2015 $ 1,005 $ 2.03 25.0%
Third Quarter 2015 $ 936 $ 1.98 22.9%
Fourth Quarter 2015 $ 798 $ 1.65 20.2%
The Company enters into fuel derivative contracts to manage its risk associated with significant
increases in fuel prices; however, as is evidenced by the table above, energy prices can fluctuate
3