Southwest Airlines 2008 Annual Report Download - page 14
Download and view the complete annual report
Please find page 14 of the 2008 Southwest Airlines annual report below. You can navigate through the pages in the report by either clicking on the pages listed below, or by using the keyword search tool below to find specific information within the annual report.-
 1
1 -
2
-
3
-
 4
4 -
 5
5 -
 6
6 -
 7
7 -
 8
8 -
 9
9 -
 10
10 -
 11
11 -
 12
12 -
 13
13 -
 14
14 -
 15
15 -
 16
16 -
 17
17 -
 18
18 -
 19
19 -
 20
20 -
 21
21 -
 22
22 -
 23
23 -
 24
24 -
25
-
26
-
27
-
28
-
29
-
30
-
31
-
32
-
33
-
34
-
35
-
36
-
37
-
38
-
39
-
40
-
41
-
42
-
43
-
44
-
45
-
46
-
47
-
48
-
49
-
50
-
51
-
52
-
53
-
54
-
55
-
56
-
57
-
58
-
59
-
60
-
61
-
62
-
63
-
64
-
65
-
66
-
67
-
68
-
69
-
70
-
71
-
72
-
73
-
74
-
75
-
76
-
77
-
78
-
79
-
80
-
81
-
82
-
83
-
84
-
85
-
86
-
87
-
88
-
89
-
90
-
91
-
92
-
93
-
94
-
95
-
96
-
97
-
98
-
99
-
100
-
101
-
102
-
103
 |
 |

Quarterly Financial Data (Unaudited) (GAAP)
Common Stock Price Ranges and Dividends
Three Months Ended
Southwest’s common stock is listed on the New York Stock Exchange and is traded under the symbol LUV. The
high, low, and close sales prices of the common stock on the Composite Tape and the quarterly dividends per share
paid on the common stock were:
PERIOD DIVIDENDS HIGH LOW CLOSE
2008
1st Quarter $ 0.0045 $ 13.10 $ 11.02 $ 12.40
2nd Quarter 0.0045 14.89 11.75 13.04
3rd Quarter 0.0045 16.77 12.68 14.51
4th Quarter 0.0045 14.97 7.05 8.62
2007
1st Quarter $ 0.0045 $ 16.58 $ 14.50 $ 14.70
2nd Quarter 0.0045 15.90 14.03 14.91
3rd Quarter 0.0045 16.96 14.21 14.80
4th Quarter 0.0045 15.06 12.12 12.20
(in millions, except per share amounts) March 31 June 30 September 30 December 31
2008
Operating revenues $ 2,530 $ 2,869 $ 2,891 $ 2,734
Operating income 88 205 86 70
Income (loss) before income taxes 37 529 (205) (83)
Net income (loss) 34 321 (120) (56)
Net income (loss) per share, basic .05 .44 (.16) (.08)
Net income (loss) per share, diluted .05 .44 (.16) (.08)
2007
Operating revenues $ 2,198 $ 2,583 $ 2,588 $ 2,492
Operating income 84 328 251 126
Income before income taxes 149 447 277 183
Net income 93 278 162 111
Net income per share, basic .12 .36 .22 .15
Net income per share, diluted .12 .36 .22 .15
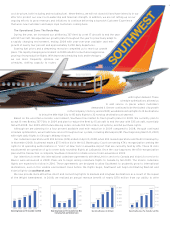
71.2%
73,492
110,000
100,000
90,000
80,000
70,000
20082004 2005 2006
92,663
103,271
99,636
2007
76,861
85,173
Available Seat Miles (in millions)
20082004 2005 2006 2007
Revenue Passenger Miles (in millions)
80,000
70,000
60,000
50,000
40,000
67,691
72,319
53,418
60,223
20082004 2005 2006 2007
Passenger Load Factor
75%
70%
65%
60%
55%
50%
73.1% 72.6%
69.5% 70.7%
13
SOUTHWEST AIRLINES CO. ANNUAL REPORT 2008