Southwest Airlines 2008 Annual Report Download - page 1
Download and view the complete annual report
Please find page 1 of the 2008 Southwest Airlines annual report below. You can navigate through the pages in the report by either clicking on the pages listed below, or by using the keyword search tool below to find specific information within the annual report.-
 1
1 -
 2
2 -
 3
3 -
 4
4 -
 5
5 -
 6
6 -
 7
7 -
 8
8 -
 9
9 -
 10
10 -
 11
11 -
 12
12 -
13
-
14
-
15
-
16
-
17
-
18
-
19
-
20
-
21
-
22
-
23
-
24
-
25
-
26
-
27
-
28
-
29
-
30
-
31
-
32
-
33
-
34
-
35
-
36
-
37
-
38
-
39
-
40
-
41
-
42
-
43
-
44
-
45
-
46
-
47
-
48
-
49
-
50
-
51
-
52
-
53
-
54
-
55
-
56
-
57
-
58
-
59
-
60
-
61
-
62
-
63
-
64
-
65
-
66
-
67
-
68
-
69
-
70
-
71
-
72
-
73
-
74
-
75
-
76
-
77
-
78
-
79
-
80
-
81
-
82
-
83
-
84
-
85
-
86
-
87
-
88
-
89
-
90
-
91
-
92
-
93
-
94
-
95
-
96
-
97
-
98
-
99
-
100
-
101
-
102
-
103
 |
 |
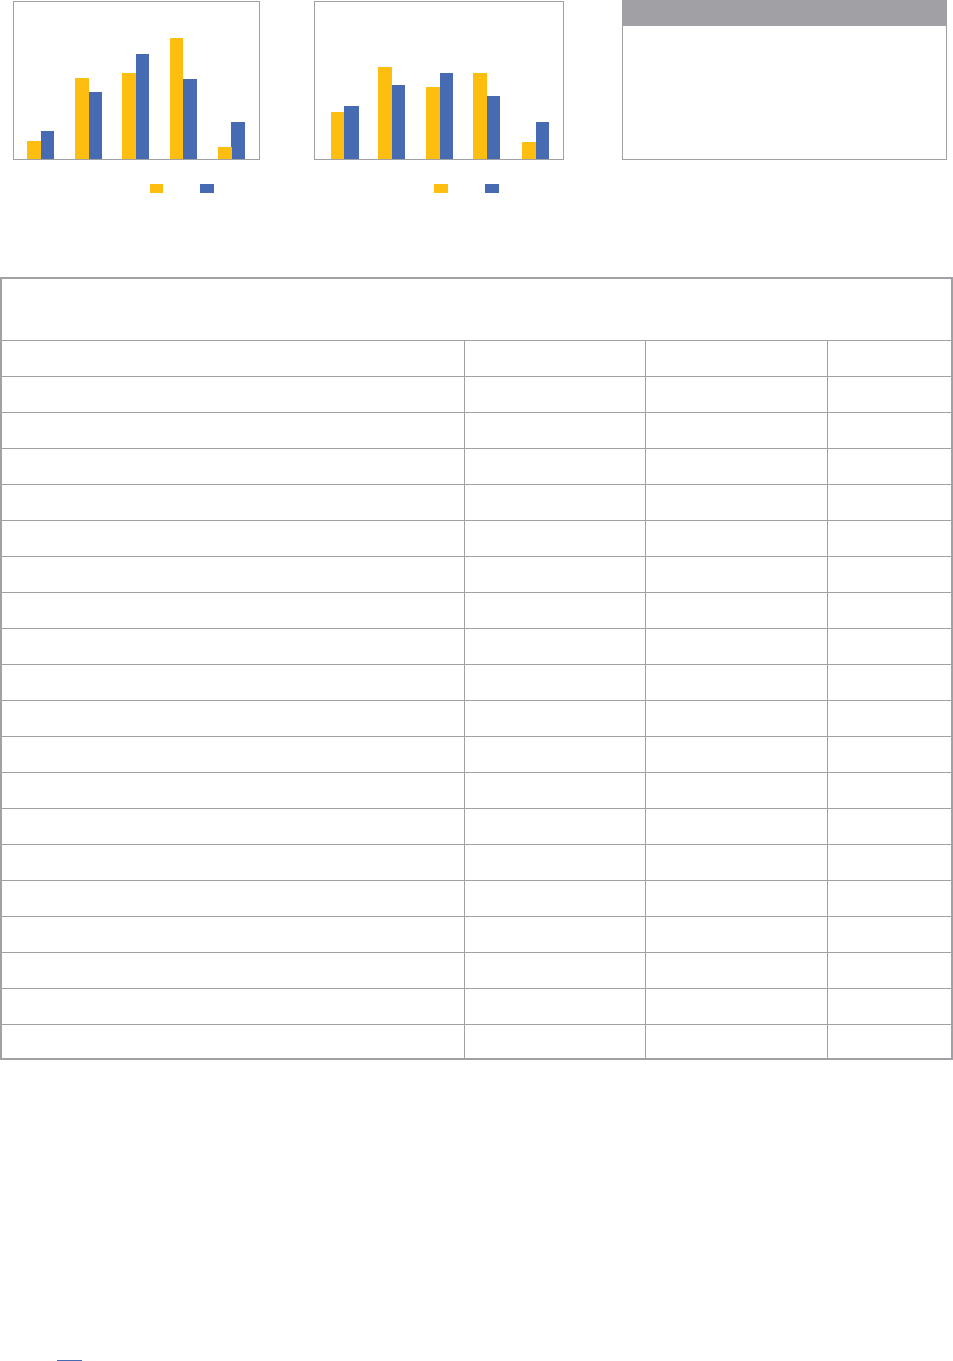
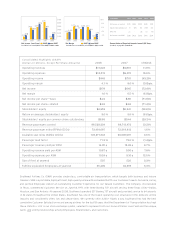
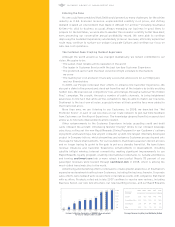
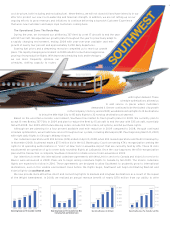
Consolidated Highlights (GAAP)
(Dollars In Millions, Except Per Share Amounts) 2008 2007 CHANGE
Operating revenues $11,023 $9,861 11.8 %
Operating expenses $10,574 $9,070 16.6 %
Operating income $449 $791 (43.2) %
Operating margin 4.1 % 8.0 % (3.9) pts.
Net income $178 $645 (72.4) %
Net margin 1.6 % 6.5 % (4.9) pts.
Net income per share——basic $.24 $.85 (71.8) %
Net income per share——diluted $.24 $.84 (71.4) %
Stockholders’ equity $4,953 $6,941 (28.6) %
Return on average stockholders’ equity 3.0 % 9.6 % (6.6) pts.
Stockholders’ equity per common share outstanding $6.69 $9.44 (29.1) %
Revenue passengers carried 88,529,234 88,713,472 (0.2) %
Revenue passenger miles (RPMs) (000s) 73,491,687 72,318,812 1.6 %
Available seat miles (ASMs) (000s) 103,271,343 99,635,967 3.6 %
Passenger load factor 71.2 % 72.6 % (1.4) pts.
Passenger revenue yield per RPM 14.35 ¢ 13.08 ¢ 9.7 %
Operating revenue yield per ASM 10.67 ¢ 9.90 ¢ 7.8 %
Operating expenses per ASM 10.24 ¢ 9.10 ¢ 12.5 %
Size of eet at yearend 537 520 3.3 %
Fulltime equivalent Employees at yearend 35,499 34,378 3.3 %
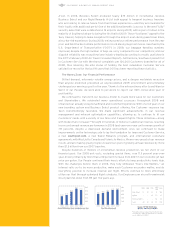
1.6%
2.7%
$178
$294
$700
$600
$500
$400
$300
$200
$215$248
$484
$425
$499
$578
$645
$471
Net Margin GAAP
10%
8%
6%
4%
2%
non-GAAP
See table for a reconciliation of non-GAAP to GAAP results.
Net Income (in millions) GAAP non-GAAP
See table for a reconciliation of non-GAAP to GAAP results.
Reconciliation of Reported Amounts to non-GAAP Items
(See Note on page 14.) (unaudited)
(in millions)
$215 $484 $499
Net income, as reported $178
$645
-(9)
22
Other net 23 (12)
$471
$425 $578$248 $294
Net income——non-GAAP
2004 2005 2006 2007 2008
20042005 2006 2007 2008 2004 2005 2006 2007 2008
3.3%3.8%
5.5%
6.4%5.6% 6.5% 6.5%
4.8% 8811 (59)
Impact of fuel contracts, net 128(197)
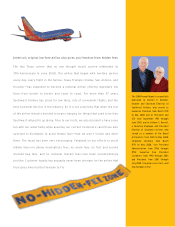
Southwest Airlines Co. (SWA) provides single-class, comfortable air transportation, which targets both business and leisure
travelers. SWA is a profitable, highly efficient, high-quality airline with a schedule that fits our Customers’ needs. Our warm, caring,
and spirited Employees deliver an outstanding Customer Experience for our Valued Customers. The Company, incorporated
in Texas, commenced Customer Service on June 18, 1971, with three Boeing 737 aircraft serving three Texas cities— —Dallas,
Houston, and San Antonio. At yearend 2008, Southwest operated 537 Boeing 737 aircraft and provided service to 64 airports
in 32 states throughout the United States. Southwest has one of the lowest operating cost structures in the domestic airline
industry and consistently offers low and simple fares. We currently offer 3,200+ flights a day. Southwest has had the best
cumulative Customer Satisfaction record among airlines for the last 18 years that the Department of Transportation has kept
these statistics. LUV is our stock exchange symbol, selected to represent both our home at Dallas Love Field and the unique,
warm, and LUVing relationships among Employees, Shareholders, and Customers.