Southwest Airlines 2005 Annual Report Download - page 14
Download and view the complete annual report
Please find page 14 of the 2005 Southwest Airlines annual report below. You can navigate through the pages in the report by either clicking on the pages listed below, or by using the keyword search tool below to find specific information within the annual report.-
 1
1 -
2
-
3
-
 4
4 -
 5
5 -
 6
6 -
 7
7 -
 8
8 -
 9
9 -
 10
10 -
 11
11 -
 12
12 -
 13
13 -
 14
14 -
 15
15 -
 16
16 -
 17
17 -
 18
18 -
 19
19 -
 20
20 -
 21
21 -
 22
22 -
 23
23 -
 24
24 -
25
-
26
-
27
-
28
-
29
-
30
-
31
-
32
-
33
-
34
-
35
-
36
-
37
-
38
-
39
-
40
-
41
-
42
-
43
-
44
-
45
-
46
-
47
-
48
-
49
-
50
-
51
-
52
-
53
-
54
-
55
-
56
-
57
-
58
-
59
-
60
-
61
-
62
-
63
-
64
-
65
-
66
-
67
-
68
-
69
-
70
-
71
-
72
-
73
-
74
-
75
-
76
-
77
-
78
 |
 |

SOUTHWEST AIRLINES CO. ANN UAL REPORT 2005
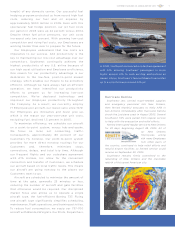
Quarterly Financial Data (Unaudited)
Commmon Stock Price Ranges and Dividends
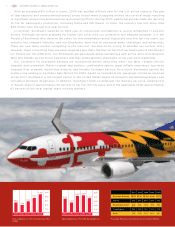
90,000
80,000
70,000
60,000
50,000
2001 2002 2003 2004
65,295 68,887
2005
71,790
76,861
85,173
Available Seat Miles (in millions)
2001 2002 2003 2004 2005
Revenue Passenger Miles (in millions)
65,000
55,000
45,000
35,000
25,000
44,494 45,392
47,943 53,418
60,223
2001 2002 2003 2004 2005
Passenger Load Factor
75%
70%
65%
60%
55%
50%
68.1%
65.9% 66.8%
69.5% 70.7%
13
Three Months Ended
Southwest’s common stock is listed on the New York Stock Exchange and is traded under the symbol
LUV. The high, low, and close sales prices of the common stock on the Composite Tape and the quarterly
dividends per share paid on the common stock were:
PERIOD DIVIDENDS HIGH LOW CLOSE
2005
1st Quarter $ 0.0045 $ 16.45 $ 13.60 $ 14.24
2nd Quarter 0.0045 15.50 13.56 13.93
3rd Quarter 0.0045 14.85 13.05 14.85
4th Quarter 0.0045 16.95 14.54 16.43
2004
1st Quarter $ 0.0045 $ 16.60 $ 12.88 $ 14 .2 1
2nd Quarter 0.0045 17.06 13.56 16.7 7
3rd Quarter 0.0045 16.8 5 13. 1 8 13.62
4th Quarter 0.0045 1 6.74 13.45 16.28
(in millions, except per share amounts) March 31 June 30 September 30 December 31
2005
Operating revenues $ 1,663 $1,944 $1,9 89 $ 1,9 87
Operating income 106 2 77 2 73 1 6 3
Income before income taxes 1 1 4 2 56 368 1 3 6
Net income 76 15 9 227 86
Net income per share, basic . 1 0 .20 .29 . 1 1
Net income per share, diluted .09 .20 . 2 8 . 1 0
2004
Operating revenues $ 1,484 $ 1 ,7 1 6 $ 1 , 6 74 $ 1,655
Operating income 46 1 9 7 1 9 1 120
Income before income taxes 4 1 1 7 9 1 8 1 89
Net income 26 1 1 3 1 1 9 56
Net income per share, basic .03 . 1 4 . 1 5 .07
Net income per share, diluted .03 . 1 4 . 1 5 .07
1