Southwest Airlines 2005 Annual Report Download - page 1
Download and view the complete annual report
Please find page 1 of the 2005 Southwest Airlines annual report below. You can navigate through the pages in the report by either clicking on the pages listed below, or by using the keyword search tool below to find specific information within the annual report.-
 1
1 -
 2
2 -
 3
3 -
 4
4 -
 5
5 -
 6
6 -
 7
7 -
 8
8 -
 9
9 -
 10
10 -
 11
11 -
 12
12 -
13
-
14
-
15
-
16
-
17
-
18
-
19
-
20
-
21
-
22
-
23
-
24
-
25
-
26
-
27
-
28
-
29
-
30
-
31
-
32
-
33
-
34
-
35
-
36
-
37
-
38
-
39
-
40
-
41
-
42
-
43
-
44
-
45
-
46
-
47
-
48
-
49
-
50
-
51
-
52
-
53
-
54
-
55
-
56
-
57
-
58
-
59
-
60
-
61
-
62
-
63
-
64
-
65
-
66
-
67
-
68
-
69
-
70
-
71
-
72
-
73
-
74
-
75
-
76
-
77
-
78
 |
 |

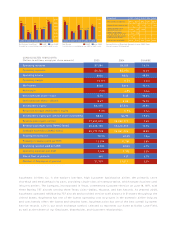
13.2%
48.0%
2.3
pts.
75.1%
2.4
pts.
75.0%
76.3%
20.8%
3.1
pts.
19.0%
9.6%
12.7%
10.8%
1.2
pts.
2.8%
4.7%
2.2%
6.7%
Operating expenses
Operating income
Operating margin
Net income
Net margin
Net income per share – basic
Net income per share – diluted
Stockholders’ equity
Revenue passengers carried
Revenue passenger miles {RPMs} (000s)
Available seat miles {ASMs} (000s)
Passenger load factor
Passenger revenue yield per RPM
Operating revenue yield per ASM
Operating expenses per ASM
Size of fleet at yearend
2.3 %
Number of Employees at yearend
Stockholders’ equity per common share outstanding
Return on average stockholders’ equity
CONSOLIDATED HIGHLIGHTS
Operating revenues
16.1%
CHANGE
(Dollars in millions, except per share amounts)
$6 ,7 64
$ 8 2 0
1 0 . 8 %
$ 5 4 8
7. 2%
$.70
$. 67
$ 6 , 6 7 5
9 . 0 %
$8.32
77,693,875
60,223,100
85,172,795
70.7%
12.09¢
8.9 0 ¢
7.94¢
445
3 1, 7 2 9
$7,584
2005
$5 ,9 76
$ 5 5 4
8 . 5 %
$ 3 1 3
4. 8%
$.40
$. 38
$ 5 , 5 2 4
5 . 9 %
$6.99
7 0 , 9 0 2 , 7 7 3
5 3 , 4 1 8 , 3 5 3
7 6 , 8 6 1 , 2 9 6
69.5%
11.76¢
8.5 0 ¢
7.77¢
417
3 1, 0 11
$6,530
2004
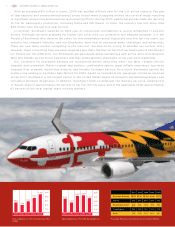
Southwest Airlines Co. is the nation’s low-fare, high Customer Satisfaction airline. We primarily serve
shorthaul and mediumhaul city pairs, providing single-class air transportation, which targets business and
leisure travelers. The Company, incorporated in Texas, commenced Customer Service on June 18, 1971, with
three Boeing 737 aircraft serving three Texas cities—Dallas, Houston, and San Antonio. At yearend 2005,
Southwest operated 445 Boeing 737 aircraft and provided service to 61 airports in 31 states throughout the
United States. Southwest has one of the lowest operating cost structures in the domestic airline industry
and consistently offers the lowest and simplest fares. Southwest also has one of the best overall Customer
Service records. LUV is our stock exchange symbol, selected to represent our home at Dallas Love Field,
as well as the theme of our Employee, Shareholder, and Customer relationships.
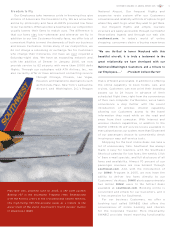
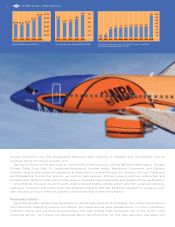
2001 2002 2003 2004 2005
$600
$500
$400
$300
$200
$100
$511
$414
$241
$191
$442
$296 $313 $324
$548
$489
Net Margin
2001 2002 2003 2004 2005
GAAP
10%
8%
6%
4%
2%
9.2%
7.5%
4.4%
3.5%
7.4%
5.0% 4.8% 5.0%
7.2%
6.4%
non-GAAP
See table for a reconciliation of non-GAAP to GAAP results.
Net Income (in millions) GAAP non-GAAP
See table for a reconciliation of non-GAAP to GAAP results.
Reconciliation of Reported Amounts to non-GAAP Items
(See note on page 15.) (unaudited)
$511
16
10
$241 $442
11
$313
1 (7) (2)
(144)
(25)
(124) -
-
(18) -
Impact of fuel contracts, net
Net Income, as reported
(in millions)
Impact of government
grant proceeds, net
Impact of passenger
revenue adjustments, net
Impact of charges arising
from terrorist attacks
$414 $324
(59)
$548
-
-
--- -
$489$191 $296
Net income – non-GAAP
2001 2002 2003 2004 2005