Ryanair 2009 Annual Report Download - page 11
Download and view the complete annual report
Please find page 11 of the 2009 Ryanair annual report below. You can navigate through the pages in the report by either clicking on the pages listed below, or by using the keyword search tool below to find specific information within the annual report.-
 1
1 -
 2
2 -
 3
3 -
 4
4 -
 5
5 -
 6
6 -
 7
7 -
 8
8 -
 9
9 -
 10
10 -
 11
11 -
 12
12 -
 13
13 -
 14
14 -
 15
15 -
 16
16 -
 17
17 -
 18
18 -
 19
19 -
 20
20 -
 21
21 -
 22
22 -
23
-
24
-
25
-
26
-
27
-
28
-
29
-
30
-
31
-
32
-
33
-
34
-
35
-
36
-
37
-
38
-
39
-
40
-
41
-
42
-
43
-
44
-
45
-
46
-
47
-
48
-
49
-
50
-
51
-
52
-
53
-
54
-
55
-
56
-
57
-
58
-
59
-
60
-
61
-
62
-
63
-
64
-
65
-
66
-
67
-
68
-
69
-
70
-
71
-
72
-
73
-
74
-
75
-
76
-
77
-
78
-
79
-
80
-
81
-
82
-
83
-
84
-
85
-
86
-
87
-
88
-
89
-
90
-
91
-
92
-
93
-
94
-
95
-
96
-
97
-
98
-
99
-
100
-
101
-
102
-
103
-
104
-
105
-
106
-
107
-
108
-
109
-
110
-
111
-
112
-
113
-
114
-
115
-
116
-
117
-
118
-
119
-
120
-
121
-
122
-
123
-
124
-
125
-
126
-
127
-
128
-
129
-
130
-
131
-
132
-
133
-
134
-
135
-
136
-
137
-
138
-
139
-
140
-
141
-
142
-
143
-
144
-
145
-
146
-
147
-
148
-
149
-
150
-
151
-
152
-
153
-
154
-
155
-
156
-
157
-
158
-
159
-
160
-
161
-
162
-
163
-
164
-
165
-
166
-
167
-
168
-
169
-
170
-
171
-
172
-
173
-
174
-
175
-
176
-
177
-
178
-
179
-
180
-
181
-
182
-
183
-
184
-
185
 |
 |

11
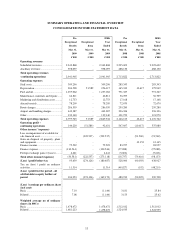
SUMMARY OPERATING AND FINANCIAL OVERVIEW
CONSOLIDATED INCOME STATEMENT DATA
Pre IFRS Pre IFRS
Exceptional Exceptional Year Exceptional Exceptional
Year
Results Items Ended Results Items Ended
Mar 31, Mar 31, Mar 31, Mar 31, Mar 31,
Mar 31,
2009 2009 2009 2008 2008 2008
€’000 €’000 €’000 €’000 €’000 €’000
Operating revenues
Scheduled revenues
................................
2,343,868 - 2,343,868 2,225,692 - 2,225,692
Ancillary revenues
................................
598,097 - 598,097 488,130 - 488,130
Total operating revenues
-continuing operations 2,941,965 - 2,941,965 2,713,822 - 2,713,822
Operating expenses
Staff costs ................................
...............
309,296 - 309,296 285,343 - 285,343
Depreciation ................................
...........
204,528 51,589 256,117 165,332 10,617 175,949
Fuel and oil ................................
............
1,257,062 - 1,257,062 791,327 - 791,327
Maintenance, materials and repairs
........
66,811 - 66,811 56,709 - 56,709
Marketing and distribution costs
............
12,753 - 12,753 17,168 - 17,168
Aircraft rentals ................................
.......
78,209 - 78,209 72,670 - 72,670
Route charges ................................
.........
286,559 - 286,559 259,280 - 259,280
Airport and handling charges
.................
443,387 - 443,387 396,326 - 396,326
Other ................................
......................
139,140 - 139,140 121,970 - 121,970
Total operating expenses 2,797,745 51,589 2,849,334 2,166,125 10,617 2,176,742
Operating profit –
continuing operations
144,220
(51,589)
92,631
547,697
(10,617)
537,080
Other income / (expenses)
Loss on impairment of available for
sale financial asset ................................
..
-
(222,537)
(222,537)
-
(91,569)
(91,569)
Gain on disposal of property, plant
and equipment ................................
........
-
-
-
-
12,153
12,145
Finance income ................................
......
75,522 - 75,522 83,957 - 83,957
Finance expense ................................
.....
(130,544) - (130,544) (97,088) - (97,088)
Foreign exchange gains / (losses)
...........
4,441 - 4,441 (5,606) - (5,606)
Total other income/(expenses) (50,581) (222,537) (273,118) (18,737) (79,416) (98,153)
(Loss) / profit before tax 93,639 (274,126) (180,487) 528,960 (90,033) 438,927
Tax on (loss) / profit on ordinary
activities ................................
.................
11,314
-
11,314
(48,027)
(192)
(48,219)
(Loss) / profit for the period - all
attributable to equity holders of
parent
104,953
(274,126)
(169,173)
480,933
(90,225)
390,708
(Loss) / earnings per ordinary share
(in € cent)
Basic ................................
......................
7.10 (11.44) 31.81 25.84
Diluted ................................
...................
7.08
(11.44) 31.53 25.62
Weighted average no of ordinary
shares (in 000’s)
Basic ................................
......................
1,478,472 1,478,472 1,512,012 1,512,012
Diluted ................................
...................
1,481,223 1,478,472 1,524,935 1,524,935