Royal Caribbean Cruise Lines 2007 Annual Report Download - page 28
Download and view the complete annual report
Please find page 28 of the 2007 Royal Caribbean Cruise Lines annual report below. You can navigate through the pages in the report by either clicking on the pages listed below, or by using the keyword search tool below to find specific information within the annual report.-
 1
1 -
2
-
3
-
4
-
5
-
6
-
7
-
8
-
9
-
10
-
11
-
12
-
13
-
14
-
15
-
16
-
17
-
 18
18 -
 19
19 -
 20
20 -
 21
21 -
 22
22 -
 23
23 -
 24
24 -
 25
25 -
 26
26 -
 27
27 -
 28
28 -
 29
29 -
 30
30 -
 31
31 -
 32
32 -
 33
33 -
 34
34 -
 35
35 -
 36
36 -
 37
37 -
 38
38 -
39
-
40
-
41
-
42
-
43
-
44
-
45
-
46
 |
 |

26
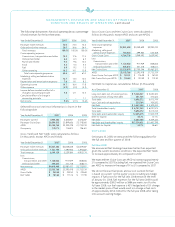
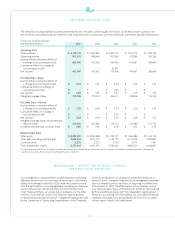
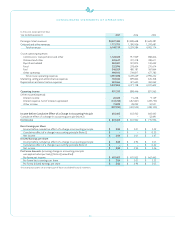
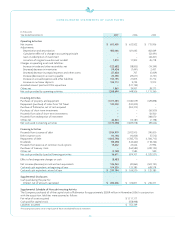
CONSOLIDATED STATEMENTS OF CASH FLOWS
(in thousands)
Year Ended December 31, 2007 2006 2005
Operating Activities
Net income
$ 603,405
$ 633,922 $ 715,956
Adjustments:
Depreciation and amortization
483,066
421,645 402,069
Cumulative effect of a change in accounting principle
–
– (52,491)
Gain on redemption of investment
–
– (44,207)
Accretion of original issue discount on debt
1,810
17,902 45,718
Changes in operating assets and liabilities:
Increase in trade and other receivables, net
(122,682)
(38,855) (19,349)
(Increase) decrease in inventories
(19,424)
(7,441) 2,457
(Increase) decrease in prepaid expenses and other assets
(37,650)
707 (5,009)
Increase (decrease) in accounts payable
23,398
(29,671) (3,741)
Increase in accrued expenses and other liabilities
150,195
21,815 31,772
Increase in customer deposits
184,713
9,724 9,912
Accreted interest paid on LYONs repurchase
–
(121,199) –
Other, net
1,863
39,957 28,273
Net cash provided byoperating activities
1,268,694
948,506 1,111,360
Investing Activities
Purchases of property and equipment
(1,317,381)
(1,180,579) (429,898)
Repayment (purchase) of notes from TUI Travel
100,000
(100,000) –
Purchase of Pullmantur, net of cash acquired
–
(553,312) –
Purchases of short-term investments
–
– (56,500)
Proceeds from sale of short-term investments
–
– 56,500
Proceeds from redemption of investment
–
– 348,070
Other,net
46,823
(15,187) (7,198)
Net cash used in investing activities
(1,170,558)
(1,849,078) (89,026)
Financing Activities
Proceeds from issuance of debt
1,934,979
2,933,915 390,000
Debt issuance costs
(10,146)
(10,004) (5,512)
Repayments of debt
(1,805,798)
(1,785,773) (1,564,715)
Dividends
(98,298)
(124,460) (118,764)
Proceeds from exercise of common stock options
19,632
23,026 21,996
Purchases of treasury stock
–
(164,582) (249,122)
Other, net
(3,758)
7,585 590
Net cash provided by (used in) financing activities
36,611
879,707 (1,525,527)
Effect of exchange rate changes on cash
(8,483)
––
Net increase (decrease) in cash and cash equivalents
126,264
(20,865) (503,193)
Cash and cash equivalents at beginning of year
104,520
125,385 628,578
Cash and cash equivalents at end of year
$ 230,784
$ 104,520 $ 125,385
Supplemental Disclosures
Cash paid during the year for:
Interest, net of amount capitalized
$ 285,206
$ 376,817 $ 236,477
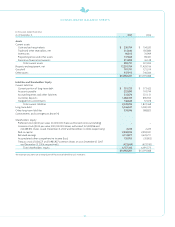
Supplemental Schedule of Noncash Investing Activity
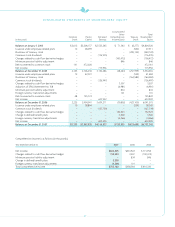
The Company purchased all of the capital stock of Pullmantur for approximately $558.9 million in November 2006. In conjunction
with the acquisition, liabilities were assumed as follows:
Fair value of assets acquired $ 1,111,117
Cash paid for capital stock (558,948)
Liabilities assumed $ 552,169
The accompanying notes are an integral part of these consolidated financial statements.