Royal Caribbean Cruise Lines 2007 Annual Report Download - page 16
Download and view the complete annual report
Please find page 16 of the 2007 Royal Caribbean Cruise Lines annual report below. You can navigate through the pages in the report by either clicking on the pages listed below, or by using the keyword search tool below to find specific information within the annual report.-
 1
1 -
2
-
3
-
4
-
5
-
 6
6 -
 7
7 -
 8
8 -
 9
9 -
 10
10 -
 11
11 -
 12
12 -
 13
13 -
 14
14 -
 15
15 -
 16
16 -
 17
17 -
 18
18 -
 19
19 -
 20
20 -
 21
21 -
 22
22 -
 23
23 -
 24
24 -
 25
25 -
 26
26 -
27
-
28
-
29
-
30
-
31
-
32
-
33
-
34
-
35
-
36
-
37
-
38
-
39
-
40
-
41
-
42
-
43
-
44
-
45
-
46
 |
 |

Our cruise operating expenses consist of the following:
Commissions, transportation and other expenses consist of those
costs directly associated with passenger ticket revenues, including
travel agent commissions, air and other transportation expenses,
port costs that vary with passenger head counts and related
credit card fees.
Onboard and other expenses consist of the direct costs associ-
ated with onboard and other revenues. These costs include the
cost of products sold onboard our ships, vacation protection
insurance premiums, costs associated with pre- and post-cruise
tours and related credit card fees. These costs also include mini-
mal costs associated with concession revenues, as the costs are
mostly incurred by third party concessionaires.
Payroll and related expenses consist of costs for shipboard
personnel.
Food expenses include food costs for both passengers and crew.
Fuel expenses include fuel and related delivery and storage costs,
including the financial impact of fuel swap agreements.
Other operating expenses consist primarily of operating costs
such as repairs and maintenance, port costs that do not vary with
passenger head counts, vessel operating lease costs, costs associ-
ated with Pullmantur Cruises’ land-based tours, vessel related
insurance and entertainment.
Wedo not allocatepayroll and related costs, food costs, fuel costs
or other operating costs to the expense categories attributable
to passenger ticket revenues or onboard and other revenues since
theyareincurred toprovide the total cruise vacation experience.
NON-GAAP FINANCIAL MEASURES
Available Passenger Cruise Days (“APCD”) are our measurement of
capacity and represent double occupancy per cabin multiplied by
the number of cruise days for the period.
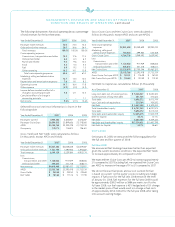
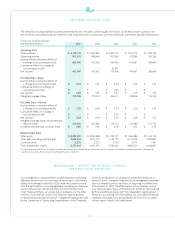
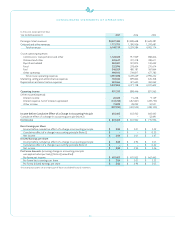
Gross Cruise Costs represent the sum of total cruise operating
expenses plus marketing, selling and administrative expenses.
Gross Yields represent total revenues per APCD.
Net Cruise Costs represent Gross Cruise Costs excluding commis-
sions, transportation and other expenses and onboard and other
expenses (each of which is described under the Terminology head-
ing). In measuring our ability to control costs in a manner that
positively impacts net income, we believe changes in Net Cruise
Costs to be the most relevant indicator of our performance.
A reconciliation of historical Gross Cruise Costs to Net Cruise
Costs is provided below under Summary of Historical Results of
Operations.We have not provided a quantitative reconciliation
of projected Gross Cruise Costs to projected Net Cruise Costs due
tothe significant uncertainty in projecting the costs deducted to
arriveat this measure. Accordingly, we do not believe that recon-
ciling information for such projected figures would be meaningful.
Net Debt-to-Capital is a ratio which represents total long-term
debt, including current portion of long-term debt, less cash and
cash equivalents (“Net Debt”) divided by the sum of Net Debt and
total shareholders’ equity. We believe Net Debt and Net Debt-to-
Capital, along with total long-term debt and shareholders’ equity
are useful measures of our capital structure. A reconciliation of
historical Debt-to-Capital to Net Debt-to-Capital is provided
below under Summary of Historical Results of Operations.
Net Revenues represent total revenues less commissions, trans-
portation and other expenses and onboard and other expenses
(each of which is described under the Terminology heading).
Net Yields represent Net Revenues per APCD. We utilize Net
Revenues and Net Yields to manage our business on a day-to-day
basis as we believe that it is the most relevant measure of our
pricing performance because it reflects the cruise revenues
earned by us net of our most significant variable costs, which are
commissions, transportation and other expenses and onboard and
other expenses. A reconciliation of historical Gross Yields to Net
Yields is provided belowunder Summary of Historical Results of
Operations. Wehave not provided a quantitative reconciliation
of projected Gross Yields to projected Net Yields due to the
significant uncertainty in projecting the costs deducted to arrive
at this measure. Accordingly, we do not believe that reconciling
information for such projected figures would be meaningful.
Occupancy, in accordance with cruise vacation industry practice, is
calculated by dividing Passenger Cruise Days by APCD. A percentage
in excessof 100% indicates that three or more passengers occupied
some cabins.
Passenger Cruise Days represent the number of passengers carried
for the period multiplied bythe number of daysof their respec-
tive cruises.
EXECUTIVE OVERVIEW
Over the past five years, we have experienced higher passenger
ticket prices and onboard revenues while maintaining strong
occupancies. As a result, Net Yields have grown from $146.63
in 2003 to $183.64 in 2007. The industry’s focus has shifted so that
alarger portion of the revenue growth has come from markets
outside of North America. We have responded to this shift by
redeploying some of our ships to certain international markets
such as Europe, Latin America and Asia, as well as focusing on the
continued development of our international passenger sourcing.
As a result, our passenger ticket revenues generated by sales
originating outside of North America has increased from approxi-
mately 19% in 2003 to 30% in 2007. Due to the recent recovery
in North American bookings and continued strengthening inter-
nationally, we expect to see further yield improvements in 2008,
in spiteof the current weakening of the U.S. economy and the
tighter credit markets. These current economic conditions,
however, could eventually have an adverse effect on vacationers’
discretionary income and consumer confidence, which could
result in a lower demand for cruises, lower cruise prices and lower
onboardrevenues in the future.
14
MANAGEMENT’S DISCUSSION AND ANALYSIS OF FINANCIAL
CONDITION AND RESULTS OF OPERATIONS continued