Royal Caribbean Cruise Lines 2004 Annual Report Download - page 34
Download and view the complete annual report
Please find page 34 of the 2004 Royal Caribbean Cruise Lines annual report below. You can navigate through the pages in the report by either clicking on the pages listed below, or by using the keyword search tool below to find specific information within the annual report.-
 1
1 -
2
-
3
-
4
-
5
-
6
-
7
-
8
-
9
-
10
-
11
-
12
-
13
-
14
-
15
-
16
-
17
-
18
-
19
-
20
-
21
-
22
-
23
-
 24
24 -
 25
25 -
 26
26 -
 27
27 -
 28
28 -
 29
29 -
 30
30 -
 31
31 -
 32
32 -
 33
33 -
 34
34 -
 35
35
 |
 |

ROYAL CARIBBEAN CRUISES LTD.
32
NOTES TO THE CONSOLIDATED FINANCIAL STATEMENTS (CONTINUED)
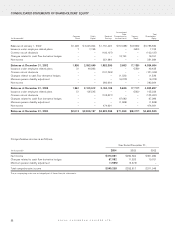
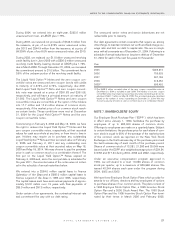
NOTE 14. QUARTERLY DATA (UNAUDITED)
(in thousands, except per share data)
First Quarter Second Quarter Third Quarter Fourth Quarter
2004 2003 2004 2003 2004 2003 2004 2003
Total revenues $1,061,684 $880,164 $1,142,999 $905,841 $1,386,107 $1,120,199 $964,585 $878,045
Operating income $160,468 $114,942 $194,586 $117,203 $358,381 $249,161 $40,154 $ 44,879
Net income (loss) $95,846 $53,174 $122,159 $ 55,672 $282,471 $191,867 $(25,785) $ (20,049)
Earnings (loss)
per share:
Basic $0.49 $0.28 $0.61 $ 0.29 $1.42 $0.99 $(0.13) $(0.10)
Diluted $0.47 $0.27 $0.58 $ 0.28 $1.26 $0.89 $(0.13) $(0.10)
Dividends declared
per share $0.13 $0.13 $0.13 $ 0.13 $0.13 $0.13 $0.13 $0.13
Weadopted the provisions of EITF 04-8 in our fourth quarter of 2004 and restated prior period earnings per share amounts for
comparative purposes. (See Note 8.
Earnings Per Share.
)The implementation of EITF 04-8 did not change our previously report-
ed diluted earnings per share, except for a reduction of $0.07 and $0.08 per sharein our thirdquarters of 2004 and 2003,
respectively, and a reduction of $0.01 per share in our second quarter of 2004.
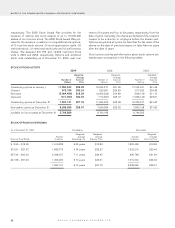
SELECTED FINANCIAL DATA
The selected consolidated financial data presented below for the years 2000 through 2004 and as of the end of each such year,are
derived from our audited financial statements and should be read in conjunction with those financial statements and the related notes.
Year Ended December 31,
(in thousands, except per share data)
2004 2003 2002 2001 2000
Operating Data:
Total revenues $4,555,375 $3,784,249 $ 3,434,347 $ 3,145,250 $2,865,846
Operating income ,753,589 ,526,185 ,550,975 ,455,605 ,569,540
Net income ,474,691 ,280,664 ,351,284 ,254,457 ,445,363
Per Share Data – Diluted:
Net income(1) $ 2.26 $ 1.42 $ 1.76 $ 1.31 $ 2.31
Weighted-average shares and
potentially dilutive shares (1) ,234,580 ,211,175 ,209,565 ,202,004 ,192,935
Dividends declared per common share $ 0.52 $ 0.52 $ 0.52 $ 0.52 $ 0.48
Balance Sheet Data:
Total assets $11,964,084 $11,322,742 $10,538,531 $10,368,782 $7,828,465
Total debt, including capital leases 5,731,944 5,835,804 5,444,838 5,646,112 3,410,096
Common stock ,002,012 ,001,961 ,001,930 ,001,923 ,001,921
Total shareholders’ equity 4,804,520 4,262,897 4,034,694 3,756,584 3,615,915
(1) We adopted the provisions of EITF 04-8 in our fourth quarter of 2004 and restated prior period diluted earnings per share amounts for comparative purposes. The
implementation of EITF 04-8 did not change our previously reported 2000 and 2003 diluted earnings per share; however, it reduced our 2002 and 2001 diluted earnings
per shareby $0.03 and $0.01, respectively.(See Note 8.
Earnings Per Share
to our consolidated financial statements.)