Royal Caribbean Cruise Lines 2004 Annual Report Download - page 15
Download and view the complete annual report
Please find page 15 of the 2004 Royal Caribbean Cruise Lines annual report below. You can navigate through the pages in the report by either clicking on the pages listed below, or by using the keyword search tool below to find specific information within the annual report.-
 1
1 -
2
-
3
-
4
-
 5
5 -
 6
6 -
 7
7 -
 8
8 -
 9
9 -
 10
10 -
 11
11 -
 12
12 -
 13
13 -
 14
14 -
 15
15 -
 16
16 -
 17
17 -
 18
18 -
 19
19 -
 20
20 -
 21
21 -
 22
22 -
 23
23 -
 24
24 -
 25
25 -
26
-
27
-
28
-
29
-
30
-
31
-
32
-
33
-
34
-
35
 |
 |

Net Cruise Costs increased 16.5% in 2004 compared to 2003.
The increase was due to the 10.3% increase in capacity men-
tioned above and a 5.6% increase in Net Cruise Costs per
APCD. The increase in Net Cruise Costs per APCD was pri-
marily attributed to increases in fuel prices, marketing, selling
and administrative expenses, crew salaries and medical
expenses, port expenses and costs associated with hurri-
canes. The weighted-average fuel price (net of the financial
impact of fuel swap agreements) for the year ended December
31, 2004 increased 14% per metric ton from the year ended
December 31, 2003. As a percentage of total revenues, fuel
costs were 5.5% and 5.2% for 2004 and 2003, respectively.
The increase in marketing, selling and administrative expenses
was primarily attributable to increases in general and adminis-
trative costs associated with the expansion of our reservations
and sales force and additional information technology projects.
In addition, advertising costs increased primarily due to an
increase in television media spending and the launch of the
Cirque du Soleil and Xpeditions marketing campaigns for
Celebrity Cruises. The increase in port expenses was primarily
attributed to itinerarychanges. In 2004, we incurred approxi-
mately $11.3 million in costs related to the impact of hurri-
canes. In 2003, other operating expenses were reduced by
approximately $5.8 million in connection with a litigation settle-
ment. Gross Cruise Costs per APCD increased 6.7% in 2004
compared to 2003 primarily due to the same reasons dis-
cussed above for Net Cruise Costs per APCD.
Depreciation and amortization expenses increased 8.7% in
2004 compared to 2003. The increase was primarily due to
incremental depreciation associated with the full year effect of
the addition of two new ships in 2003 and one new ship in 2004.
OTHER INCOME (EXPENSE)
Gross interest expense increased to $317.2 million in 2004
from $284.3 million in 2003. The increase was primarily attrib-
utable to a higher average debt level and higher interest rates.
Interest capitalized during 2004 decreased to $7.2 million from
$15.9 million in 2003 due to a lower average level of invest-
ment in ships under construction.
YEAR ENDED DECEMBER 31, 2003 COMPARED TO
YEAR ENDED DECEMBER 31, 2002
REVENUES
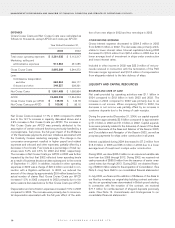
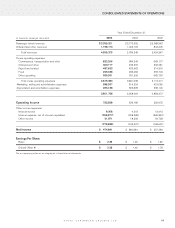
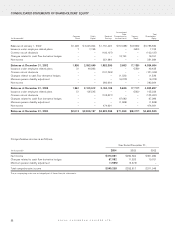
Gross Yields and Net Yields were calculated as follows (in
thousands, except APCD and Yields):
Year Ended December 31,
2003 2002
Passenger ticket revenues $ 2,775,055 $2,589,942
Onboard and other revenues 1,009,194 844,405
Total revenues 3,784,249 3,434,347
Less:
Commissions, transportation
and other ,684,344 669,177
Onboard and other ,249,537 208,231
Net revenues $ 2,850,368 $ 2,556,939
APCD 19,439,238 17,334,204
Gross Yields $194.67 $ 198.13
Net Yields $146.63 $ 147.51
Net revenues increased 11.5% in 2003 compared to 2002. The
increase was due to a 12.1% increase in capacity,offset by a
0.6% decrease in Net Yields. The increase in capacity was pri-
marily associated with the full year effect of the additions of
Constellation
,
Brilliance of the Seas
and
Navigator of the Seas
in 2002 and the addition of two new ships in 2003. The increase
in capacity was partially offset by the cancellation of 46 days of
sailings in 2003 due to unscheduled drydocks and the transfer
of
Viking Serenade
to Island Cruises, our joint venture with First
Choice Holidays PLC, in 2002. The decrease in Net Yields was
primarily due to lower cruise ticket prices and occupancy levels
attributable to consumer apprehension towards travel prior to
and during the war in Iraq and economic uncertainty. The
decrease was partially offset by an increase in net onboard and
other revenues due to the assumption of certain onboard func-
tions previously handled by a concessionaire. Occupancy in
2003 was 103.2% compared to 104.5% in 2002. Gross Yields
decreased 1.7% in 2003 compared to 2002 primarily due to the
same reasons discussed above for Net Yields.
Onboardand other revenues included concession revenues of
$163.0 million and $162.0 million in 2003 and 2002, respec-
tively, which increased in 2003 primarily due to the same rea-
sons discussed above for net revenues.
ROYAL CARIBBEAN CRUISES LTD. 13
MANAGEMENT’S DISCUSSION AND ANALYSIS OF FINANCIAL CONDITION AND RESULTS OF OPERATIONS (CONTINUED)