Royal Caribbean Cruise Lines 2004 Annual Report Download - page 16
Download and view the complete annual report
Please find page 16 of the 2004 Royal Caribbean Cruise Lines annual report below. You can navigate through the pages in the report by either clicking on the pages listed below, or by using the keyword search tool below to find specific information within the annual report.-
 1
1 -
2
-
3
-
4
-
5
-
 6
6 -
 7
7 -
 8
8 -
 9
9 -
 10
10 -
 11
11 -
 12
12 -
 13
13 -
 14
14 -
 15
15 -
 16
16 -
 17
17 -
 18
18 -
 19
19 -
 20
20 -
 21
21 -
 22
22 -
 23
23 -
 24
24 -
 25
25 -
 26
26 -
27
-
28
-
29
-
30
-
31
-
32
-
33
-
34
-
35
 |
 |

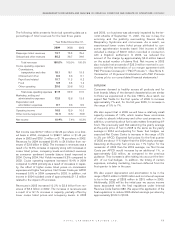
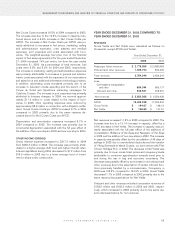
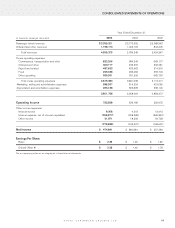
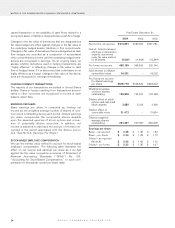
EXPENSES
Gross Cruise Costs and Net Cruise Costs were calculated as
follows (in thousands, except APCD and costs per APCD):
Year Ended December 31,
2003 2002
Total cruise operating expenses $ 2,381,035 $ 2,113,217
Marketing, selling and
administrative expenses ,514,334 431,055
Gross Cruise Costs 2,895,369 2,544,272
Less:
Commissions, transportation
and other ,684,344 669,177
Onboard and other ,249,537 208,231
Net Cruise Costs $ 1,961,488 $ 1,666,864
APCD 19,439,238 17,334,204
Gross Cruise Costs per APCD $148.94 $ 146.78
Net Cruise Costs per APCD $100.90 $ 96.16
Net Cruise Costs increased 17.7% in 2003 compared to 2002
due to the 12.1% increase in capacity discussed above and a
4.9% increase in Net Cruise Costs per APCD. The increase in
Net Cruise Costs per APCD was primarily attributed to the
assumption of certain onboardfunctions previously handled by a
concessionaire, fuel prices, the full year impact of the
Brilliance
of the Seas
lease payments and new initiatives associated with
the Celebrity Cruises marketing campaign. The change in the
concession arrangement resulted in higher payroll and related
expenses and onboard and other expenses, partially offset by a
decrease in food costs. Fuel costs as a percentage of total rev-
enues were 5.2% and 4.5% for 2003 and 2002, respectively.
The increase in Net Cruise Costs per APCD in 2003 was further
impacted by the fact that 2002 reflected lower spending levels
as a result of business decisions taken subsequent to the events
of September 11, 2001. In addition, included in other operating
expenses in 2002 was a charge of $20.0 million recorded in con-
nection with a litigation settlement. In 2003, we reduced the
amount of the charge by approximately $5.8 million based on the
actual number of claims filed. Gross Cruise Costs per APCD
increased 1.5% in 2003 compared to 2002 primarily due to the
same reasons discussed above for Net Cruise Costs per APCD.
Depreciation and amortization expenses increased 7.0% in 2003
compared to 2002. The increase was primarily due to incremen-
tal depreciation associated with the full year effect of the addi-
tion of two new ships in 2002 and two new ships in 2003.
OTHER INCOME (EXPENSE)
Gross interest expense decreased to $284.3 million in 2003
from $290.3 million in 2002. The decrease was primarily attrib-
utable to lower interest rates. Interest capitalized during 2003
decreased to $15.9 million from $23.4 million in 2002 due to a
lower average level of investment in ships under construction
and lower interest rates.
Included in other income in 2002 was $33.0 million of net pro-
ceeds received in connection with the termination of the P&O
Princess merger agreement and $12.3 million of compensation
from shipyards related to the late delivery of ships.
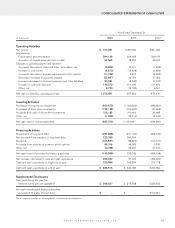
LIQUIDITY AND CAPITAL RESOURCES
SOURCES AND USES OF CASH
Net cash provided by operating activities was $1.1 billion in
2004 compared to $0.9 billion in both 2003 and 2002. The
increase in 2004 compared to 2003 was primarily due to an
increase in net income. When comparing 2003 to 2002, the
decrease in net income was partially offset by an increase in
customer deposits due to the timing of cash receipts.
During the year ended December 31, 2004, our capital expendi-
tures were approximately $0.6 billion compared to approximate-
ly $1.0 billion in 2003 and $1.0 billion in 2002. Capital expendi-
tures were primarily related to the deliveries of
Jewel of the Seas
in 2004;
Serenade of the Seas
and
Mariner of the Seas
in 2003;
and
Constellation
and
Navigator of the Seas
in 2002, as well as
progress payments for ships under construction in all years.
Interest capitalized during 2004 decreased to $7.2 million from
$15.9 million in 2003 and $23.4 million in 2002 due to a lower
average level of investment in ships under construction.
During 2004, we drew $225.0 million on an unsecured variable rate
term loan due 2006 through 2012. During 2003, we received net
cash proceeds of $590.5 million from the issuance of senior unse-
cured notes due through 2013. During 2002, we obtained financ-
ing of $320.0 million related to the acquisition of
Constellation
.(See
Note 6.
Long-Term Debt
to our consolidated financial statements.)
In July 2002, we financed the addition of
Brilliance of the Seas
to
our fleet by novating our original ship building contract and enter-
ing into an operating lease denominated in British pound sterling.
In connection with the novation of the contract, we received
$77.7 million for reimbursement of shipyard deposits previously
made. (See Note 12.
Commitments and Contingencies
to our
consolidated financial statements.)
ROYAL CARIBBEAN CRUISES LTD.
14
MANAGEMENT’S DISCUSSION AND ANALYSIS OF FINANCIAL CONDITION AND RESULTS OF OPERATIONS (CONTINUED)