Royal Caribbean Cruise Lines 2004 Annual Report Download - page 13
Download and view the complete annual report
Please find page 13 of the 2004 Royal Caribbean Cruise Lines annual report below. You can navigate through the pages in the report by either clicking on the pages listed below, or by using the keyword search tool below to find specific information within the annual report.-
 1
1 -
2
-
 3
3 -
 4
4 -
 5
5 -
 6
6 -
 7
7 -
 8
8 -
 9
9 -
 10
10 -
 11
11 -
 12
12 -
 13
13 -
 14
14 -
 15
15 -
 16
16 -
 17
17 -
 18
18 -
 19
19 -
 20
20 -
 21
21 -
 22
22 -
 23
23 -
24
-
25
-
26
-
27
-
28
-
29
-
30
-
31
-
32
-
33
-
34
-
35
 |
 |

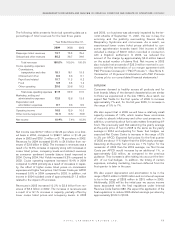
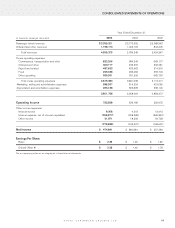
The following table presents historical operating data as a
percentage of total revenues for the last three years:
Year Ended December 31,
2004 2003 2002
Passenger ticket revenues 73.7 73.3 75.4
Onboard and other revenues 26.3 26.7 24.6
Total revenues 100.0% 100.0% 100.0%
Cruise operating expenses
Commissions,
transportation and other 18.1 18.1 19.5
Onboard and other 6.6 6.6 6.1
Payroll and related 10.7 11.3 9.2
Food 5.9 6.3 7.4
Other operating 20.6 20.6 19.3
Total cruise operating expenses 61.9 62.9 61.5
Marketing, selling and
administrative expenses 12.9 13.6 12.6
Depreciation and
amortization expenses 8.7 9.6 9.9
Operating income 16.5 13.9 16.0
Other income (expense) (6.1) (6.5) (5.8)
Net income 10.4% 7.4% 10.2%
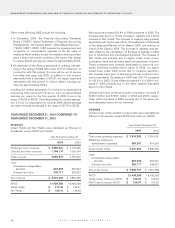
Net income was $474.7 million or $2.26 per shareon a dilut-
ed basis in 2004, compared to $280.7 million or $1.42 per
share in 2003 and $351.3 million or $1.76 per share in 2002.
Revenues for 2004 increased 20.4% to $4.6 billion from rev-
enues of $3.8 billion in 2003. The increase in revenues was a
result of a 10.3% increase in capacity along with increases in
cruise ticket prices, occupancy levels and onboard revenues
as consumer sentiment towards leisuretravel improved in
2004. During 2004, Net Yields increased 9.2% compared to
2003. Cruise operating expenses increased 18.4% in 2004
compared to 2003 primarily as a result of increases in capac-
ity,the effect of higher cruise ticket prices on commission
expenses and higher fuel prices. Net Cruise Costs per APCD
increased 5.6% in 2004 compared to 2003. In addition, net
income in 2004 included costs of approximately $11.3 million
related to the impact of hurricanes.
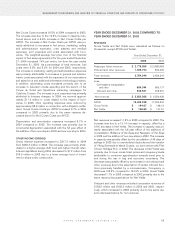
Revenues in 2003 increased 10.2% to $3.8 billion from rev-
enues of $3.4 billion in 2002. The increase in revenues was
aresult of a 12.1% increase in capacity, partially offset by
lower cruise ticket prices and occupancy levels. In 2003
and 2002, our business was adversely impacted by the ter-
rorist attacks of September 11, 2001, the war in Iraq, the
economy and the publicity surrounding Severe Acute
Respiratory Syndrome and noroviruses. As a result, we
experienced lower cruise ticket prices attributed to con-
sumer apprehension towards travel. Net income in 2002
included a charge of $20.0 million recorded in connection
with a litigation settlement. In 2003, we reduced the
amount of the charge by approximately $5.8 million based
on the actual number of claims filed. Net income in 2002
also included net proceeds of $33.0 million received in con-
nection with the termination of our merger agreement with
P&O Princess Cruises plc (“P&O Princess”). (See Note 3.
Termination of Proposed Combination with P&O Princess
Cruises plc
to our consolidated financial statements.)
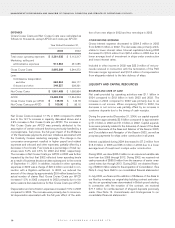
OUTLOOK
Consumer demand is healthy across all products and for
both brands. Many of the demand characteristics aresimilar
to those we experienced in the late 1990’s. As a result, we
expect Net Yields for the first quarter of 2005 to increase
approximately 7% and, for the full year 2005, to increase in
the range of 5% to 7%.
We also expect that in 2005 we will have a relatively small
capacity increase of 1.6%, which means fewer economies
of scale to absorb inflationary and other cost pressures. In
addition, uncertainty about fuel costs makes forecasting dif-
ficult. We previously said that assuming the yearly average
at-the-pump price of fuel in 2005 is the same as the yearly
average in 2004 and adjusting for fewer fuel hedges, we
expected Net Cruise Costs to increase in the range of 2%
to 3% per APCD. Expected fuel prices for the first quarter
of 2005 areabout 11% higher than the 2004 yearly average.
Assuming at-the-pump fuel prices are 11% higher for the
remainder of 2005 than the 2004 average, our Net Cruise
Costs per APCD would increase by an additional 1%, or
approximately $23 million, as compared to the previous
guidance. This increase is after taking into account the ben-
efit of our fuel hedges. In addition, the timing of certain
expenses, including marketing, has been deferred from the
first quarter to later in the year.
We also expect depreciation and amortization to be in the
range of $410 million to $420 million and net interest expense
to be in the range of $305 million to $315 million in 2005.
Additionally, 2005 will be the initial year we accrue income
taxes associated with the final regulations under Internal
Revenue Code Section 883. We expect the application of the
final regulations to reduce 2005 diluted earnings per share by
approximately $0.04 to $0.05.
ROYAL CARIBBEAN CRUISES LTD. 11
MANAGEMENT’S DISCUSSION AND ANALYSIS OF FINANCIAL CONDITION AND RESULTS OF OPERATIONS (CONTINUED)