Royal Caribbean Cruise Lines 2003 Annual Report Download - page 15
Download and view the complete annual report
Please find page 15 of the 2003 Royal Caribbean Cruise Lines annual report below. You can navigate through the pages in the report by either clicking on the pages listed below, or by using the keyword search tool below to find specific information within the annual report.-
 1
1 -
2
-
3
-
4
-
 5
5 -
 6
6 -
 7
7 -
 8
8 -
 9
9 -
 10
10 -
 11
11 -
 12
12 -
 13
13 -
 14
14 -
 15
15 -
 16
16 -
 17
17 -
 18
18 -
 19
19 -
 20
20 -
 21
21 -
 22
22 -
 23
23 -
 24
24 -
 25
25 -
26
-
27
-
28
-
29
-
30
-
31
-
32
-
33
-
34
-
35
-
36
 |
 |

Based on the above, we expect 2004 earnings per share to be
in the range of $2.10 to $2.30.
Our Liquid Yield OptionTM Notes become convertible during the
second, third and fourth quarters of 2004 if the share price of
our common stock closes above $46.08, $46.64 and $47.20,
respectively, for 20 days out of the last 30 trading days of each
quarter. If the notes become convertible, full year earnings per
share would be reduced by approximately $0.02.
Year Ended December 31, 2003 Compared to
Year Ended December 31, 2002
REVENUES
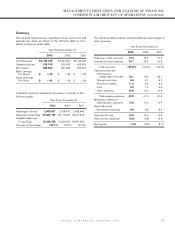
Passenger ticket revenues increased 7.1% to $2.8 billion in
2003 compared to $2.6 billion in 2002. The increase in pas-
senger ticket revenues was primarily due to a 12.1% increase
in capacity, partially offset by lower cruise ticket prices and
occupancy levels. The increase in capacity was primarily asso-
ciated with the full year effect of the additions of
Constellation
,
Brilliance of the Seas
and
Navigator of the Seas
and the deliv-
eries of
Serenade of the Seas
and
Mariner of the Seas
in
2003. The increase in capacity was partially offset by the can-
cellation of sailings due to the unanticipated drydock of two
ships in 2003 and the transfer of
Viking Serenade
to Island
Cruises, our joint venture with First Choice Holidays PLC, in
2002. Lower cruise ticket prices and occupancy levels were
attributable to consumer apprehension towards travel prior to
and during the war in Iraq and continued economic uncertainty.
Occupancy in 2003 was 103.2% compared to 104.5% in 2002.
Onboard and other revenues increased 19.5% to $1.0 billion in
2003 compared to $0.8 billion in 2002. The increase was main-
ly attributable to a 19.8% increase in shipboard revenues
resulting primarily from an increase in capacity and the assump-
tion of certain onboard functions previously handled by a con-
cessionaire. Included in onboard and other revenues were con-
cession revenues of $163.0 million and $162.0 million in 2003
and 2002, respectively.
Gross Yields and Net Yields for 2003 decreased 1.7% and
0.6%, respectively, compared to 2002, primarily due to lower
cruise ticket prices and occupancy levels.
EXPENSES
Operating expenses increased 12.7% to $2.4 billion in 2003
compared to $2.1 billion in 2002. The increase was primarily
due to costs associated with an increase in capacity, the
assumption of certain onboard functions previously handled by
a concessionaire, fuel costs and the
Brilliance of the Seas
lease. The change in the concession arrangement resulted in
higher payroll and related expenses and onboard and other
expenses, partially offset by a decrease in food costs. Fuel
costs as a percentage of total revenues were 5.2% and 4.5%
for 2003 and 2002, respectively. Included in other operating
expenses in 2002 was a charge of $20.0 million recorded in
connection with a litigation settlement. In 2003, we reduced the
amount of the charge by approximately $5.8 million based on
the actual number of claims filed in these actions. (See Note
12. Commitments and Contingencies.) Operating expenses
per Available Passenger Cruise Day increased 0.5% in 2003
compared to 2002.
Marketing, selling and administrative expenses increased
19.3% to $514.3 million in 2003 compared to $431.1 million in
2002. The increase in 2003 was primarily attributable to new
initiatives associated with the Celebrity Cruises marketing
campaign and a return to more normalized spending levels. The
year 2002 reflected lower spending levels as a result of busi-
ness decisions taken subsequent to the events of September
11, 2001. Marketing, selling and administrative expenses as a
percentage of total revenues were 13.6% and 12.6% in 2003
and 2002, respectively. On a per Available Passenger Cruise
Day basis, marketing, selling and administrative expenses in
2003 increased 6.4% from 2002.
Net Cruise Costs per Available Passenger Cruise Day
increased 4.9% in 2003 compared to 2002. The increase in
2003 was primarily attributed to higher payroll and related
expenses, fuel costs,
Brilliance of the Seas
lease payments,
marketing costs associated with the Celebrity Cruises market-
ing campaign and a return to more normalized spending levels,
partially offset by the reduction in the litigation settlement
charge and a decrease in food costs.
Depreciation and amortization expenses increased 7.0% to
$362.7 million in 2003 from $339.1 million in 2002. The
increase was primarily due to incremental depreciation associ-
ated with the addition of new ships.
OTHER INCOME (EXPENSE)
Gross interest expense decreased to $284.3 million in 2003
from $290.3 million in 2002. The decrease was primarily attrib-
utable to lower interest rates. Capitalized interest decreased to
$15.9 million in 2003 from $23.4 million in 2002 due to a lower
average level of investment in ships under construction and
lower interest rates.
Included in other income (expense) in 2002 was $33.0 million
of net proceeds received in connection with the termination of
the P&O Princess merger agreement and $12.3 million of com-
pensation from shipyards related to the late delivery of ships.
ROYAL CARIBBEAN CRUISES LTD. 13
MANAGEMENT’S DISCUSSION AND ANALYSIS OF FINANCIAL
CONDITION AND RESULTS OF OPERATIONS (CONTINUED)