Ricoh 2004 Annual Report Download - page 3
Download and view the complete annual report
Please find page 3 of the 2004 Ricoh annual report below. You can navigate through the pages in the report by either clicking on the pages listed below, or by using the keyword search tool below to find specific information within the annual report.-
 1
1 -
 2
2 -
 3
3 -
 4
4 -
 5
5 -
 6
6 -
 7
7 -
 8
8 -
 9
9 -
 10
10 -
 11
11 -
 12
12 -
 13
13 -
 14
14 -
15
-
16
-
17
-
18
-
19
-
20
-
21
-
22
-
23
-
24
-
25
-
26
-
27
-
28
-
29
-
30
-
31
-
32
-
33
-
34
-
35
-
36
-
37
-
38
-
39
-
40
-
41
-
42
-
43
-
44
-
45
-
46
-
47
-
48
-
49
-
50
-
51
-
52
-
53
-
54
-
55
-
56
-
57
-
58
-
59
-
60
 |
 |

Editorial Policy
Corporate Profile/
Financial Highlights/
Contents
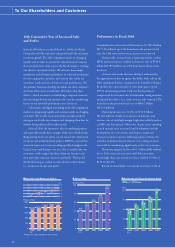
To Our Shareholders and Customers
Review of Operations (General Information by Business Area)
Technology
Corporate Social Responsibility
Environment
Financial Section
Ricoh's Global Network
Senior Management
Corporate Data
2
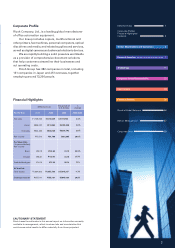
Corporate Profile
CAUTIONARY STATEMENT
Ricoh Company, Ltd., is a leading global manufacturer
of office automation equipment.
Our lineup includes copiers, multifunctional and
other printers, fax machines, personal computers, optical
disc drives and media, and related supplies and services,
as well as digital cameras and advanced electronic devices.
We are rapidly building a solid presence worldwide
as a provider of comprehensive document solutions
that help customers streamline their businesses and
cut operating costs.
Ricoh Group has 382 companies in total, including
131 companies in Japan and 251 overseas, together
employing around 73,200 people.
Ricoh bases the estimates in this annual report on information currently
available to management, which involves risks and uncertainties that
could cause actual results to differ materially from those projected.
Financial Highlights
For the Year:
Net sales
Japan
Overseas
Net income
Basic
Diluted
Cash dividends paid
At Year-End:
Per Share Data
(in yen and dollars):
Net income
Total assets
Shareholders' investment
Millions of yen Thousands of
U.S. dollars
%
change
¥1,780,245
¥914,060
¥866,185
¥72,513
¥99.79
¥96.81
¥14.00
¥1,884,922
¥657,514
2004
¥1,738,358
¥896,022
¥842,336
¥91,766
¥123.63
¥123.63
¥15.00
¥1,852,793
¥795,131
2003
$17,117,740 2.4%
$8,789,038 2.0%
$8,328,702 2.8%
$882,365 26.6%
$1.19 23.9%
$1.19 27.7%
$0.14 7.1%
$17,815,317 -1.7%
$7,645,490 20.9%
2004 2004/2003
1
2
3
7
11
13
15
16
56
57
58