Ricoh 2004 Annual Report Download - page 18
Download and view the complete annual report
Please find page 18 of the 2004 Ricoh annual report below. You can navigate through the pages in the report by either clicking on the pages listed below, or by using the keyword search tool below to find specific information within the annual report.-
 1
1 -
2
-
3
-
4
-
5
-
6
-
7
-
 8
8 -
 9
9 -
 10
10 -
 11
11 -
 12
12 -
 13
13 -
 14
14 -
 15
15 -
 16
16 -
 17
17 -
 18
18 -
 19
19 -
 20
20 -
 21
21 -
 22
22 -
 23
23 -
 24
24 -
 25
25 -
 26
26 -
 27
27 -
 28
28 -
29
-
30
-
31
-
32
-
33
-
34
-
35
-
36
-
37
-
38
-
39
-
40
-
41
-
42
-
43
-
44
-
45
-
46
-
47
-
48
-
49
-
50
-
51
-
52
-
53
-
54
-
55
-
56
-
57
-
58
-
59
-
60
 |
 |

17
Revenues
In fiscal 2004 (extending from April 1st, 2003 to March 31st, 2004),
consolidated net sales of the Ricoh Group increased 2.4% from the previous
corresponding period to ¥1,780.2 billion ($17,118 million), and this was the
10th consecutive revenue growth. The average exchange rates prevailing
during the term were ¥113.09 to the dollar (up ¥8.87) and ¥132.65 to the
euro (down ¥11.65). Accordingly, the increase in sales with respect to the
previous period would be 1.8%, excluding the effect of such foreign
exchange fluctuation.
In terms of the domestic market, sales increased for Printing Systems
such as multifunctional printers (MFPs) and laser printers. Although sales
performance also became favorable for solutions business such as support
services and document management, sales of optical disc decreased. As a
result of these factors, overall sales of Office Equipment increased 1.4% from
the previous corresponding period. In terms of Other Businesses areas,
furthermore, results were affected by poor demand for measuring
equipment. However, optical equipments, leasing and other business
continue to perform favorably. Consequently, overall domestic sales
increased 2.0% to ¥914.0 billion ($8,789 million). Domestic sales accounted
for 51.3% of consolidated net sales, down 0.2 percentage point.
In terms of overseas sales, though sales decreased due to the yen’s
appreciation against the dollar in the United States, our office equipment
business continued to perform favorably in Europe. In other areas, sluggish
demand for optical disc products led to a reduction in sales figures. In terms
of sales by product category, our core products–namely, color plain paper
copiers (PPCs) and Printing Systems–generated increased sales, and this
compensated for reduced sales of standalone analog equipments and optical
discs. As a result of these factors, sales in overseas markets increased 2.8%
from the previous corresponding previous period to ¥866.1 billion ($8,329
million). Overseas sales would increased 1.5%, excluding the effect of
foreign exchange rates fluctuations. Furthermore, these sales accounted for
48.7% of consolidated net sales, up 0.2 percentage point.
Operating Income
Gross profit increased 2.7% to ¥765.6 billion ($7,362 million). In both
Japan and abroad, sales increased for high-margin, high-value-added
products–notably MFPs and laser printers–and in addition to the effect of
the yen’s depreciation against the euro, Ricoh also benefited from ongoing
cost cutting efforts.
Selling, general and administrative expenses increased 2.0% to ¥623.9
billion ($5,999 million). This increase was primarily due to strategic
spending on research and development, the development of core systems,
and losses of ¥5.9 billion ($57 million) incurred as a result of settlement of
tax qualified pension plan.
Ricoh completed its transfer to the Japanese government of the
substitutional portion of the Employee Pension Fund (EPF). Ricoh
recognized as settlement loss of ¥48.6 billion ($468 million) and subsidy
from government of ¥56.9 billion ($548 million) for the transfer of such
substitutional portion of the EPF.
Consequently, operating income increased by 12.2% from the previous
corresponding period to ¥150.0 billion ($1,442 million).
Management’s Discussion and Analysis of Fiscal 2004 Results
Japan
The Americas
Europe
Other
Total
SALES BY GEOGRAPHIC AREA
SALES BY PRODUCT LINE
Office Equipment:
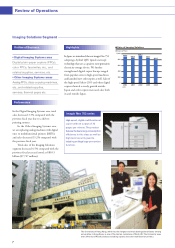
Imaging Solutions
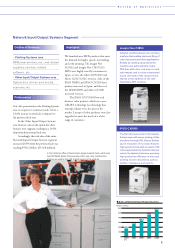
Network Input/Output Systems
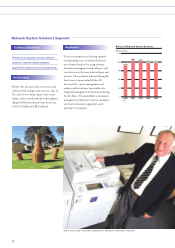
Network System Solutions
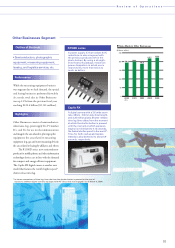
Other Businesses
Total
2003
Thousands of
U.S. dollars
Percentage of
net sales
Millions of yen
Percentage of
net sales
Millions of yen
2004
¥ 859,713
463,379
197,482
217,784
¥1,738,358
49.5%
26.7
11.3
12.5
100.0%
¥ 803,574
558,237
195,822
222,612
¥1,780,245
45.1%
31.4
11.0
12.5
100.0%
$ 7,726,673
5,367,663
1,882,904
2,140,500
$17,117,740
2003
Thousands of
U.S. dollars
Percentage of
net sales
Millions of yen
Percentage of
net sales
Millions of yen
2004
¥ 896,022
343,940
354,477
143,919
¥1,738,358
51.5%
19.8
20.4
8.3
100.0%
¥ 914,060
326,380
402,392
137,413
¥1,780,245
51.3
%
18.3
22.6
7.8
100.0%
$
8,789,038
3,138,269
3,869,154
1,321,279
$
17,117,740