Ricoh 2003 Annual Report Download - page 4
Download and view the complete annual report
Please find page 4 of the 2003 Ricoh annual report below. You can navigate through the pages in the report by either clicking on the pages listed below, or by using the keyword search tool below to find specific information within the annual report.-
 1
1 -
 2
2 -
 3
3 -
 4
4 -
 5
5 -
 6
6 -
 7
7 -
 8
8 -
 9
9 -
 10
10 -
 11
11 -
 12
12 -
 13
13 -
 14
14 -
 15
15 -
16
-
17
-
18
-
19
-
20
-
21
-
22
-
23
-
24
-
25
-
26
-
27
-
28
-
29
-
30
-
31
-
32
-
33
-
34
-
35
-
36
-
37
-
38
-
39
-
40
-
41
-
42
-
43
-
44
-
45
-
46
-
47
-
48
-
49
-
50
-
51
-
52
-
53
-
54
-
55
-
56
-
57
-
58
-
59
 |
 |

2
As part of an ongoing commitm ent to improving shareholder returns, we raised cash divi-
dends per share of common stock for the third consecutive year, to ¥14.00 ( $0.11) .
At the close of fiscal 2003, total assets were up 2.8% from a year earlier, at ¥1,884.9 billion
( $15,974 m illion) . Total liabilities increased 2.2%, to ¥1,174.1 billion ( $9,950 m illion) .
Total shareholders’ investm ent was up 3.9%, to ¥657.5 billion ( $5,572 million) .
Net cash provided by operating activities was up ¥80.6 billion, to ¥185.7 billion ( $1,574 m il-
lion) . This owed to higher net income and depreciation and amortization and a decrease in
inventories as a result of strong supply chain management.
Net cash used in investing activities increased ¥16.7 billion, to ¥98.1 billion ( $832 m illion) .
This stemmed from higher capital expenditures for new production lines and additions to bond
investm ents.
Free cash flow generated by operating and investing activities thus totaled ¥87.5 billion
( $742 million) , up ¥63.8 billion.
Net cash used in financing activities was ¥67.1 billion ( $569 m illion) , compared with ¥36.2
billion provided by such activities in fiscal 2002. This reflected reductions in interest-bearing
debt to harness Group funds m ore efficiently. Outlays included dividend payments of ¥10.1 bil-
lion ( $86 million) and expenses of ¥17.2 billion ( $146 m illion) to secure treasury stock.
As a result of these factors, cash and cash equivalents at the close of the term were ¥19.0 bil-
lion higher than a year earlier, at ¥189.2 billion ( $1,604 million) .
AGGRESSIVE STRATEGIES
During the year, we continued to go from strength to strength in implem enting our 14th medi-
um -term business plan to broaden our revenues and earnings foundations. The plan addresses
two im portant emerging trends. First, users increasingly seek ways to enhance productivity.
Second, they rely more on color-based docum ents nowadays and have to handle m ore information.
Our plan has three basic com ponents, all of which will help us build total docum ent volum e
and increase sales and profits.
The first is to replace m onochrome products with color models. We are building a full line-
up of com pact color m achines at prices com parable to m onochrome models so we can secure
new markets by meeting new demand for color. We won top m arks in Japan and abroad during
the year for our Aficio AP 3800C ( IPSiO Color 8000 in Japan) series of fast color laser printers,
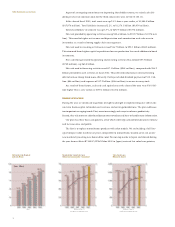
Basic Diluted
( Billions of Yen, %)
* See Note 2 on inside front cover.
TOTAL ASSETS AND
RETURN ON ASSETS
( Billions of Yen, %)
* See Note 3 on inside front cover.
NET INCOM E PER SHARE OF
COM M ON STOCK
( Yen )
SHAREHOLDERS’ IN VESTM EN T AND
RETURN ON SHAREHOLDERS’ INVESTM ENT
TOOUR SHAREHOLDERS AND CUSTOM ERS