Ricoh 2002 Annual Report Download - page 6
Download and view the complete annual report
Please find page 6 of the 2002 Ricoh annual report below. You can navigate through the pages in the report by either clicking on the pages listed below, or by using the keyword search tool below to find specific information within the annual report.-
 1
1 -
 2
2 -
 3
3 -
 4
4 -
 5
5 -
 6
6 -
 7
7 -
 8
8 -
 9
9 -
 10
10 -
 11
11 -
 12
12 -
 13
13 -
 14
14 -
 15
15 -
 16
16 -
 17
17 -
18
-
19
-
20
-
21
-
22
-
23
-
24
-
25
-
26
-
27
-
28
-
29
-
30
-
31
-
32
-
33
-
34
-
35
-
36
-
37
-
38
-
39
-
40
-
41
-
42
-
43
-
44
-
45
-
46
-
47
-
48
-
49
-
50
-
51
-
52
-
53
-
54
-
55
-
56
-
57
-
58
-
59
-
60
 |
 |

1998
88.27
1 9 9 9
44.97
2000
4 4 .3 3
2001 2002
60.61
76.85
0
1 8
3 6
5 4
7 2
9 0
82.46
41.35 40.94
56.06
71.02
Basic Diluted
3
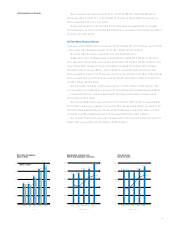
Basic net income per share increased 14.9%, to ¥88.27 ( $0.66) , while fully diluted net
income per share was up 16.1%, to ¥82.46 ( $0.62) . Return on shareholders’ investm ent was
10.4%, compared with 9.7% a year earlier.
In line with our policy of m axim izing shareholder returns in keeping with our stronger
earnings picture, we raised cash dividends ¥1.00 per share of com mon stock for the second year
running, to ¥13.00 ( $0.10) .
ANEVEN BETTER FINANCIAL POSITION
At the close of fiscal 2002, total assets stood at ¥1,832.9 billion ( $13,781 m illion) , up 7.5% from
a year earlier. Total liabilities rose 4.4%, to ¥1,148.8 billion ( $8,638 million) .
We continued to m aintain a strong free cash flow during the year.
Higher net incom e and depreciation and am ortization added ¥20.0 billion to cash flows
from operating activities from a year earlier, which were ¥135.3 billion ( ¥1,018 m illion) at the
close of fiscal 2002. Changes in assets and liabilities included ¥17.2 billion ( $129 m illion)
deposited for the maturity of Ricoh’s sixth and eighth convertible bond issues by year-end.
Changes would have been as in the previous fiscal year if not for this factor. Most of those bonds
were converted upon m aturity. Thus, net cash provided by operating activities increased 2.3%,
to ¥105.1 billion ( $790 m illion) .
Net cash used in investing activities decreased 4.9%, to ¥65.7 billion ( $494 m illion) . This
was m ainly because of spending to set up new manufacturing lines and develop new products.
Consequently, the free cash flow generated by operating and investing activities totaled
¥39.3 billion ( $295 m illion) .
Net cash provided by financing activities was ¥36.2 billion ( $272 m illion) , compared with
¥88.3 billion used in such activities a year earlier. This change stem med from our efforts to cut
interest-bearing debt dom estically and abroad while preparing for long-term expansion from
our fourth and fifth straight bond issues, which totaled ¥60 billion ( $451 m illion) .
As a result of these factors, cash and cash equivalents at the close of the term were up ¥78.0
billion from a year earlier, at ¥142.5 billion ( $1,071 million) .
0
130
260
390
520
650
1998 1999 2000 2001 2002
0
3
6
9
1 2
1 5
633.0
475.0 487.4
541.5 556.7
1 0 .4
6 .7
6 .4
8 .1
9 .7
( Billions of Yen, %)
0
400
800
1200
1600
2000
1998 1999
1660.4
2000
1628.0
2001
1543.3
2002
1,704.7
1,832.9
0
1
2
3
4
5
1 .8 1 .9
2 .6
3 .3
3 .5
TOTAL ASSETS AND
RETURN ON ASSETS
( Billions of Yen, %)
NET INCOM E PER SHARE OF
COM M ON STOCK
( Yen )
SHAREHOLDERS’ INVESTM ENT AND
RETURN ON SHAREHOLDERS’ IN VESTM ENT
TOOUR SHAREHOLDERS AND CUSTOM ERS