Ricoh 2002 Annual Report Download - page 4
Download and view the complete annual report
Please find page 4 of the 2002 Ricoh annual report below. You can navigate through the pages in the report by either clicking on the pages listed below, or by using the keyword search tool below to find specific information within the annual report.-
 1
1 -
 2
2 -
 3
3 -
 4
4 -
 5
5 -
 6
6 -
 7
7 -
 8
8 -
 9
9 -
 10
10 -
 11
11 -
 12
12 -
 13
13 -
 14
14 -
 15
15 -
16
-
17
-
18
-
19
-
20
-
21
-
22
-
23
-
24
-
25
-
26
-
27
-
28
-
29
-
30
-
31
-
32
-
33
-
34
-
35
-
36
-
37
-
38
-
39
-
40
-
41
-
42
-
43
-
44
-
45
-
46
-
47
-
48
-
49
-
50
-
51
-
52
-
53
-
54
-
55
-
56
-
57
-
58
-
59
-
60
 |
 |

1
MAKING INNOVATION WORK
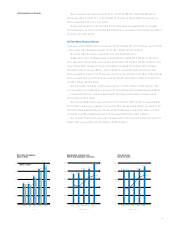
Ricoh again posted record results in fiscal 2002, with both revenues and profits rising for the
eighth and 10th consecutive years, respectively. We also delivered solid net incom e per share
and return on shareholders’ investment. Our excellent performance stem med from an even
greater focus on technological innovation as the key to making Ricoh a more attractive long-
term investm ent for shareholders.
TRIUM PHING OVER ADVERSITY
We faced an even tougher operating environm ent worldwide in fiscal 2002. Nonetheless, we
triumphed by boosting net sales 8.7%, to a record ¥1,672.3 billion ( $12,573 million) . This was
our eighth straight gain. The rise would have been 4.0% after factoring out foreign exchange
fluctuations, which underscores the inherent strength of our perform ance. Such high-value-
added digital im aging solutions as monochrom e and color digital plain-paper copiers ( PPCs)
and printing systems, notably multifunctional printers ( MFPs) , continued to foster overall
growth.
Domestic results were mixed, with sales slipping 3.0%, to ¥902.6 billion ( $6,786 m illion) .
This stemm ed largely from constrained corporate capital investm ent in information technolo-
gy. But it is worth noting that such restraint was selective. For example, sales soared 28.6% for
printing systems, which offer trem endous m arket potential.
We went from strength to strength overseas, boosting sales there 26.6%, to ¥769.6 billion
( $5,787 million) . Overseas sales gained 14.6% after factoring out exchange rate changes. We
enjoyed excellent growth in all regions, particularly the Americas and Europe. Dem and was
buoyant for our digital im aging and printing system s. U.S. subsidiary Lanier Worldwide, Inc.,
also contributed m uch to perform ance through its drive to expand marketing of digital equip-
ment and secure more maj or accounts.
Our earnings im proved greatly. Operating income surged 23.4%, to ¥129.6 billion ( $975
million) , on the back of strong dem and for high-m argin digital PPCs and MFPs, which helped
keep cost of sales expansion well below revenue growth. As a result, net income advanced
15.8%, to ¥61.6 billion ( $463 m illion) . This was yet another record high and was also the 10th
consecutive gain.
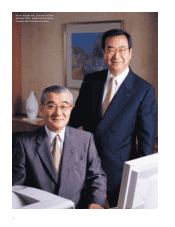
TOOUR SHAREHOLDERS AND CUSTOM ERS
0
350
700
1050
1400
1750
1998 1999
1,672.3
2000
1,403.3
2001
1,425.9
2002
1,447.1
1,538.2
0
1
2
3
4
5
3 .7
2 .1 2 .1
2 .9
3 .5
NET SALES AND RETURN ON SALES
( Billions of Yen, %)
1998
6 1 .6
1999
3 0 .1
2000
3 0 .6
2001
4 1 .9
2002
5 3 .2
0
1 3
2 6
3 9
5 2
6 5
NET INCOM E
( Billions of Yen)