RBS 2013 Annual Report Download - page 438
Download and view the complete annual report
Please find page 438 of the 2013 RBS annual report below. You can navigate through the pages in the report by either clicking on the pages listed below, or by using the keyword search tool below to find specific information within the annual report.-
 1
1 -
2
-
3
-
4
-
5
-
6
-
7
-
8
-
9
-
10
-
11
-
12
-
13
-
14
-
15
-
16
-
17
-
18
-
19
-
20
-
21
-
22
-
23
-
24
-
25
-
26
-
27
-
28
-
29
-
30
-
31
-
32
-
33
-
34
-
35
-
36
-
37
-
38
-
39
-
40
-
41
-
42
-
43
-
44
-
45
-
46
-
47
-
48
-
49
-
50
-
51
-
52
-
53
-
54
-
55
-
56
-
57
-
58
-
59
-
60
-
61
-
62
-
63
-
64
-
65
-
66
-
67
-
68
-
69
-
70
-
71
-
72
-
73
-
74
-
75
-
76
-
77
-
78
-
79
-
80
-
81
-
82
-
83
-
84
-
85
-
86
-
87
-
88
-
89
-
90
-
91
-
92
-
93
-
94
-
95
-
96
-
97
-
98
-
99
-
100
-
101
-
102
-
103
-
104
-
105
-
106
-
107
-
108
-
109
-
110
-
111
-
112
-
113
-
114
-
115
-
116
-
117
-
118
-
119
-
120
-
121
-
122
-
123
-
124
-
125
-
126
-
127
-
128
-
129
-
130
-
131
-
132
-
133
-
134
-
135
-
136
-
137
-
138
-
139
-
140
-
141
-
142
-
143
-
144
-
145
-
146
-
147
-
148
-
149
-
150
-
151
-
152
-
153
-
154
-
155
-
156
-
157
-
158
-
159
-
160
-
161
-
162
-
163
-
164
-
165
-
166
-
167
-
168
-
169
-
170
-
171
-
172
-
173
-
174
-
175
-
176
-
177
-
178
-
179
-
180
-
181
-
182
-
183
-
184
-
185
-
186
-
187
-
188
-
189
-
190
-
191
-
192
-
193
-
194
-
195
-
196
-
197
-
198
-
199
-
200
-
201
-
202
-
203
-
204
-
205
-
206
-
207
-
208
-
209
-
210
-
211
-
212
-
213
-
214
-
215
-
216
-
217
-
218
-
219
-
220
-
221
-
222
-
223
-
224
-
225
-
226
-
227
-
228
-
229
-
230
-
231
-
232
-
233
-
234
-
235
-
236
-
237
-
238
-
239
-
240
-
241
-
242
-
243
-
244
-
245
-
246
-
247
-
248
-
249
-
250
-
251
-
252
-
253
-
254
-
255
-
256
-
257
-
258
-
259
-
260
-
261
-
262
-
263
-
264
-
265
-
266
-
267
-
268
-
269
-
270
-
271
-
272
-
273
-
274
-
275
-
276
-
277
-
278
-
279
-
280
-
281
-
282
-
283
-
284
-
285
-
286
-
287
-
288
-
289
-
290
-
291
-
292
-
293
-
294
-
295
-
296
-
297
-
298
-
299
-
300
-
301
-
302
-
303
-
304
-
305
-
306
-
307
-
308
-
309
-
310
-
311
-
312
-
313
-
314
-
315
-
316
-
317
-
318
-
319
-
320
-
321
-
322
-
323
-
324
-
325
-
326
-
327
-
328
-
329
-
330
-
331
-
332
-
333
-
334
-
335
-
336
-
337
-
338
-
339
-
340
-
341
-
342
-
343
-
344
-
345
-
346
-
347
-
348
-
349
-
350
-
351
-
352
-
353
-
354
-
355
-
356
-
357
-
358
-
359
-
360
-
361
-
362
-
363
-
364
-
365
-
366
-
367
-
368
-
369
-
370
-
371
-
372
-
373
-
374
-
375
-
376
-
377
-
378
-
379
-
380
-
381
-
382
-
383
-
384
-
385
-
386
-
387
-
388
-
389
-
390
-
391
-
392
-
393
-
394
-
395
-
396
-
397
-
398
-
399
-
400
-
401
-
402
-
403
-
404
-
405
-
406
-
407
-
408
-
409
-
410
-
411
-
412
-
413
-
414
-
415
-
416
-
417
-
418
-
419
-
420
-
421
-
422
-
423
-
424
-
425
-
426
-
427
-
 428
428 -
 429
429 -
 430
430 -
 431
431 -
 432
432 -
 433
433 -
 434
434 -
 435
435 -
 436
436 -
 437
437 -
 438
438 -
 439
439 -
 440
440 -
 441
441 -
 442
442 -
 443
443 -
 444
444 -
 445
445 -
 446
446 -
 447
447 -
 448
448 -
449
-
450
-
451
-
452
-
453
-
454
-
455
-
456
-
457
-
458
-
459
-
460
-
461
-
462
-
463
-
464
-
465
-
466
-
467
-
468
-
469
-
470
-
471
-
472
-
473
-
474
-
475
-
476
-
477
-
478
-
479
-
480
-
481
-
482
-
483
-
484
-
485
-
486
-
487
-
488
-
489
-
490
-
491
-
492
-
493
-
494
-
495
-
496
-
497
-
498
-
499
-
500
-
501
-
502
-
503
-
504
-
505
-
506
-
507
-
508
-
509
-
510
-
511
-
512
-
513
-
514
-
515
-
516
-
517
-
518
-
519
-
520
-
521
-
522
-
523
-
524
-
525
-
526
-
527
-
528
-
529
-
530
-
531
-
532
-
533
-
534
-
535
-
536
-
537
-
538
-
539
-
540
-
541
-
542
-
543
-
544
-
545
-
546
-
547
-
548
-
549
-
550
-
551
-
552
-
553
-
554
-
555
-
556
-
557
-
558
-
559
-
560
-
561
-
562
-
563
-
564
 |
 |

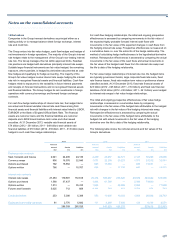
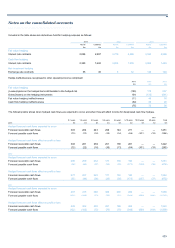
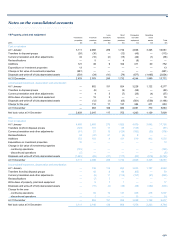
Notes on the consolidated accounts
436
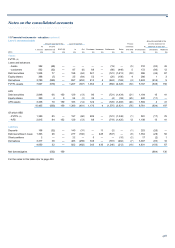
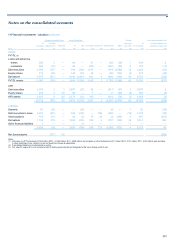
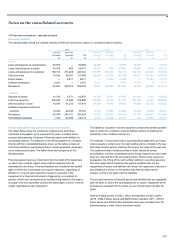
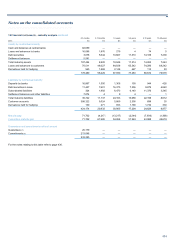
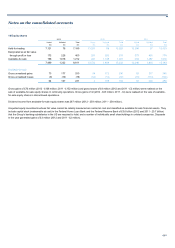
12 Financial instruments - maturity analysis continued
0-3 months 3-12 months 1-3 years 3-5 years 5-10 years 10-20 years
2011 £m £m £m £m £m £m
A
ssets by contractual maturit
y
Cash and balances at central banks 79,269 — — — — —
Loans and advances to banks 26,326 1,294 544 121 114 —
Debt securities 7,237 9,569 23,137 21,003 39,148 15,869
Settlement balances 7,759 8 — 1 — —
Other financial assets 397 158 — 16 738 —
Total maturing assets 120,988 11,029 23,681 21,141 40,000 15,869
Loans and advances to customers 97,318 90,894 108,331 55,785 62,085 56,259
Derivatives held for hedging 519 1,556 3,438 1,695 596 138
218,825 103,479 135,450 78,621 102,681 72,266
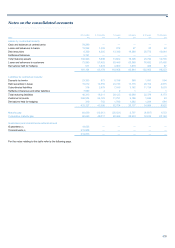
Liabilities by contractual maturity
Deposits by banks 39,139 5,104 5,513 461 1,121 364
Debt securities in issue 66,253 15,756 25,099 17,627 18,833 4,190
Subordinated liabilities 133 1,116 4,392 7,872 8,654 3,488
Settlement balances and other liabilities 9,015 37 36 62 16 15
Total maturing liabilities 114,540 22,013 35,040 26,022 28,624 8,057
Customer accounts 379,692 23,068 12,643 5,389 1,483 779
Derivatives held for hedging 525 788 1,981 1,186 1,101 821
494,757 45,869 49,664 32,597 31,208 9,657
Maturity gap 6,448 (10,984) (11,359) (4,881) 11,376 7,812
Cumulative maturity gap 6,448 (4,536) (15,895) (20,776) (9,400) (1,588)
Guarantees and commitments notional amount
Guarantees (1) 24,886 — — — — —
Commitments (2) 239,963 — — — — —
264,849 — — — — —
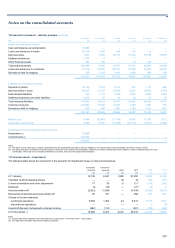
Notes:
(1) The Group is only called upon to satisfy a guarantee when the guaranteed party fails to meet its obligations. The Group expects most guarantees it provides to expire unused.
(2) The Group has given commitments to provide funds to customers under undrawn formal facilities, credit lines and other commitments to lend subject to certain conditions being met by the
counterparty. The Group does not expect all facilities to be drawn, and some may lapse before drawdown.
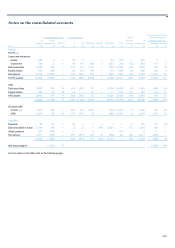
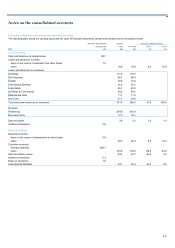
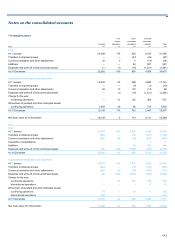
13 Financial assets - impairments
The following table shows the movement in the provision for impairment losses on loans and advances.
Individually Collectively
assessed assessed Latent 2013 2012 2011
£m £m £m £m £m £m
A
t 1 January 12,749 6,541 1,960 21,250 19,883 18,182
Transfers (to)/from disposal groups — — (9) (9) 764 (773)
Currency translation and other adjustments 77 36 8 121 (310) (283)
Disposals (4) (73) — (77) (5) 8
A
mounts written-off (2,652) (1,694) — (4,346) (4,266) (4,527)
Recoveries of amounts previously written-off 95 161 — 256 341 527
Charge to income statement
- continuing operations 6,904 1,464 44 8,412 5,315 7,241
- discontinued operations — — — — 4 (8)
Unwind of discount (recognised in interest income) (260) (131) — (391) (476) (484)
A
t 31 December (1) 16,909 6,304 2,003 25,216 21,250 19,883
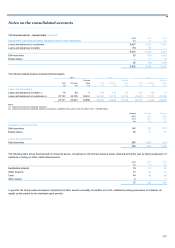
Notes:
(1) Includes £63 million relating to loans and advances to banks (2012 - £114 million; 2011 - £123 million).
(2) The table above excludes impairments relating to securities.