RBS 2013 Annual Report Download - page 331
Download and view the complete annual report
Please find page 331 of the 2013 RBS annual report below. You can navigate through the pages in the report by either clicking on the pages listed below, or by using the keyword search tool below to find specific information within the annual report.-
 1
1 -
2
-
3
-
4
-
5
-
6
-
7
-
8
-
9
-
10
-
11
-
12
-
13
-
14
-
15
-
16
-
17
-
18
-
19
-
20
-
21
-
22
-
23
-
24
-
25
-
26
-
27
-
28
-
29
-
30
-
31
-
32
-
33
-
34
-
35
-
36
-
37
-
38
-
39
-
40
-
41
-
42
-
43
-
44
-
45
-
46
-
47
-
48
-
49
-
50
-
51
-
52
-
53
-
54
-
55
-
56
-
57
-
58
-
59
-
60
-
61
-
62
-
63
-
64
-
65
-
66
-
67
-
68
-
69
-
70
-
71
-
72
-
73
-
74
-
75
-
76
-
77
-
78
-
79
-
80
-
81
-
82
-
83
-
84
-
85
-
86
-
87
-
88
-
89
-
90
-
91
-
92
-
93
-
94
-
95
-
96
-
97
-
98
-
99
-
100
-
101
-
102
-
103
-
104
-
105
-
106
-
107
-
108
-
109
-
110
-
111
-
112
-
113
-
114
-
115
-
116
-
117
-
118
-
119
-
120
-
121
-
122
-
123
-
124
-
125
-
126
-
127
-
128
-
129
-
130
-
131
-
132
-
133
-
134
-
135
-
136
-
137
-
138
-
139
-
140
-
141
-
142
-
143
-
144
-
145
-
146
-
147
-
148
-
149
-
150
-
151
-
152
-
153
-
154
-
155
-
156
-
157
-
158
-
159
-
160
-
161
-
162
-
163
-
164
-
165
-
166
-
167
-
168
-
169
-
170
-
171
-
172
-
173
-
174
-
175
-
176
-
177
-
178
-
179
-
180
-
181
-
182
-
183
-
184
-
185
-
186
-
187
-
188
-
189
-
190
-
191
-
192
-
193
-
194
-
195
-
196
-
197
-
198
-
199
-
200
-
201
-
202
-
203
-
204
-
205
-
206
-
207
-
208
-
209
-
210
-
211
-
212
-
213
-
214
-
215
-
216
-
217
-
218
-
219
-
220
-
221
-
222
-
223
-
224
-
225
-
226
-
227
-
228
-
229
-
230
-
231
-
232
-
233
-
234
-
235
-
236
-
237
-
238
-
239
-
240
-
241
-
242
-
243
-
244
-
245
-
246
-
247
-
248
-
249
-
250
-
251
-
252
-
253
-
254
-
255
-
256
-
257
-
258
-
259
-
260
-
261
-
262
-
263
-
264
-
265
-
266
-
267
-
268
-
269
-
270
-
271
-
272
-
273
-
274
-
275
-
276
-
277
-
278
-
279
-
280
-
281
-
282
-
283
-
284
-
285
-
286
-
287
-
288
-
289
-
290
-
291
-
292
-
293
-
294
-
295
-
296
-
297
-
298
-
299
-
300
-
301
-
302
-
303
-
304
-
305
-
306
-
307
-
308
-
309
-
310
-
311
-
312
-
313
-
314
-
315
-
316
-
317
-
318
-
319
-
320
-
 321
321 -
 322
322 -
 323
323 -
 324
324 -
 325
325 -
 326
326 -
 327
327 -
 328
328 -
 329
329 -
 330
330 -
 331
331 -
 332
332 -
 333
333 -
 334
334 -
 335
335 -
 336
336 -
 337
337 -
 338
338 -
 339
339 -
 340
340 -
 341
341 -
342
-
343
-
344
-
345
-
346
-
347
-
348
-
349
-
350
-
351
-
352
-
353
-
354
-
355
-
356
-
357
-
358
-
359
-
360
-
361
-
362
-
363
-
364
-
365
-
366
-
367
-
368
-
369
-
370
-
371
-
372
-
373
-
374
-
375
-
376
-
377
-
378
-
379
-
380
-
381
-
382
-
383
-
384
-
385
-
386
-
387
-
388
-
389
-
390
-
391
-
392
-
393
-
394
-
395
-
396
-
397
-
398
-
399
-
400
-
401
-
402
-
403
-
404
-
405
-
406
-
407
-
408
-
409
-
410
-
411
-
412
-
413
-
414
-
415
-
416
-
417
-
418
-
419
-
420
-
421
-
422
-
423
-
424
-
425
-
426
-
427
-
428
-
429
-
430
-
431
-
432
-
433
-
434
-
435
-
436
-
437
-
438
-
439
-
440
-
441
-
442
-
443
-
444
-
445
-
446
-
447
-
448
-
449
-
450
-
451
-
452
-
453
-
454
-
455
-
456
-
457
-
458
-
459
-
460
-
461
-
462
-
463
-
464
-
465
-
466
-
467
-
468
-
469
-
470
-
471
-
472
-
473
-
474
-
475
-
476
-
477
-
478
-
479
-
480
-
481
-
482
-
483
-
484
-
485
-
486
-
487
-
488
-
489
-
490
-
491
-
492
-
493
-
494
-
495
-
496
-
497
-
498
-
499
-
500
-
501
-
502
-
503
-
504
-
505
-
506
-
507
-
508
-
509
-
510
-
511
-
512
-
513
-
514
-
515
-
516
-
517
-
518
-
519
-
520
-
521
-
522
-
523
-
524
-
525
-
526
-
527
-
528
-
529
-
530
-
531
-
532
-
533
-
534
-
535
-
536
-
537
-
538
-
539
-
540
-
541
-
542
-
543
-
544
-
545
-
546
-
547
-
548
-
549
-
550
-
551
-
552
-
553
-
554
-
555
-
556
-
557
-
558
-
559
-
560
-
561
-
562
-
563
-
564
 |
 |

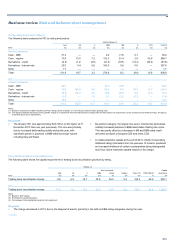
Business review Risk and balance sheet management
329
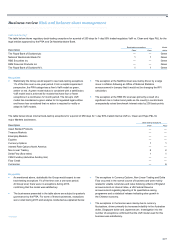
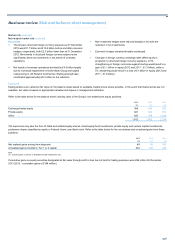
Risks not in VaR (RNIVs)*
The table below analyses capital requirements related to RNIVs.
2013 2012
£m £m
Risks Not in VaR (RNIV) 30 94
Risks Not in SVaR (RNISV) 39 149
Stressed RNIV (SRNIV) 149 187
218 430
Key points
• The decreases in the VaR RNIV and SVaR RNIV were driven by
progress in obtaining reliable sources of equity market data and by
an improvement in the VaR model for asset-backed products.
• The decrease in the Stressed RNIV primarily reflected a reduction in
RBSSI’s asset-backed products exposures.
Stress testing*
The Group undertakes daily market risk stress testing to identify
vulnerabilities and potential losses in excess of or not captured in VaR.
The calculated stresses measure the impact of changes in risk factors on
the fair values of the Group’s trading and available-for-sale portfolios.
The Group conducts scenario-based sensitivity analysis and historical,
macroeconomic and bottom-up stress testing.
Scenario-based sensitivity analysis measures the sensitivity of the
current portfolio to defined movements in market risk factors. These risk
factor movements and the resulting valuation changes are typically
smaller than those considered in other stress tests.
Historical stress testing is a measure that is used for internal
management. Using a similar technical framework to VaR, the current
portfolio is stressed using historical data since 1 January 2005. The
methodology simulates the impact of the worst loss that would be
incurred by historical risk factor movements over the period, assuming a
holding period specific to the risk factors and the businesses. At present,
a holding period of 60 business days is applied for credit risk factors
(including in the case of ABS) and for the AFS portfolios that are held by
Markets Treasury and generally a period of 10 business days for other
risk factors. The Group reviews the holding periods annually and is
considering introducing greater distinction between the liquidity
assumptions associated with each risk factor.
The main strength of this methodology is that it is founded on objective
data and the potential loss is directly informed by real-life examples. As
with all historically based methodologies, an obvious limitation is that the
approach it is not forward-looking. However, this weakness is materially
addressed by the other stress testing approaches that constitute the RBS
stress testing framework.
Historical stress tests form part of the Group market risk limit framework
and their results are reported daily to senior management.
*unaudited
Macroeconomic stress tests are carried out periodically as part of the
firm-wide, cross-risk capital planning process. The scenario narratives
are translated into risk factor shocks using historical events and insights
by economists, risk managers and the front office. Market risk stress
results are combined with those for other risks into the capital plan that is
presented to the Board. The cross-risk capital planning process is
conducted twice a year, in April/May and October/November, with a
planning horizon of five years. The scenario narratives cover both
regulatory scenarios such as the PRA Anchor and Fed Stress
comprehensive capital assessment review (CCAR) and macroeconomic
scenarios identified by the firm such as a Euro Break-Up and the US
Fiscal Cliff.
Bottom-up stress testing begins with the analysis of a portfolio and
expresses the key vulnerabilities of the portfolio in terms of plausible, so-
called vulnerability scenarios under which the portfolio would suffer
material losses. These scenarios can be historical, forward-looking,
macroeconomic or hypothetical. Bottom-up stress testing is used for
internal management information and is not subject to limits. However,
relevant scenarios are reported to senior management.
Economic capital
A market risk economic capital framework was developed in 2013 and
will be introduced in the Group’s internal reporting during 2014.
The associated models calculate the market and default risk in the
trading book. The results are annualised to be consistent with the other
Group economic capital models to permit consolidation of all risk types as
part of the Group-wide economic capital programme.
Other risk measures
In addition to SVaR and stress tests, the Group uses a range of other risk
measures to complement VaR. These measures often represent local
(small-amplitude) risk calculations which provide valuable additional
controls, often at individual desk or business unit level. They mainly
include, but are not limited to, sensitivity and position-based risk
measures.
Sensitivity measures refer to the changes in deal or portfolio value that
result from small changes in market parameters that are subject to the
Group market risk limit framework.
Position-based measures are also used and are stated in terms that
relate directly to the business activity they are applied to. Examples of
such measures include the aggregate open foreign exchange position or
the long, short and net amount of security or currency held and aged
inventory in trading books.