RBS 2013 Annual Report Download - page 116
Download and view the complete annual report
Please find page 116 of the 2013 RBS annual report below. You can navigate through the pages in the report by either clicking on the pages listed below, or by using the keyword search tool below to find specific information within the annual report.-
 1
1 -
2
-
3
-
4
-
5
-
6
-
7
-
8
-
9
-
10
-
11
-
12
-
13
-
14
-
15
-
16
-
17
-
18
-
19
-
20
-
21
-
22
-
23
-
24
-
25
-
26
-
27
-
28
-
29
-
30
-
31
-
32
-
33
-
34
-
35
-
36
-
37
-
38
-
39
-
40
-
41
-
42
-
43
-
44
-
45
-
46
-
47
-
48
-
49
-
50
-
51
-
52
-
53
-
54
-
55
-
56
-
57
-
58
-
59
-
60
-
61
-
62
-
63
-
64
-
65
-
66
-
67
-
68
-
69
-
70
-
71
-
72
-
73
-
74
-
75
-
76
-
77
-
78
-
79
-
80
-
81
-
82
-
83
-
84
-
85
-
86
-
87
-
88
-
89
-
90
-
91
-
92
-
93
-
94
-
95
-
96
-
97
-
98
-
99
-
100
-
101
-
102
-
103
-
104
-
105
-
 106
106 -
 107
107 -
 108
108 -
 109
109 -
 110
110 -
 111
111 -
 112
112 -
 113
113 -
 114
114 -
 115
115 -
 116
116 -
 117
117 -
 118
118 -
 119
119 -
 120
120 -
 121
121 -
 122
122 -
 123
123 -
 124
124 -
 125
125 -
 126
126 -
127
-
128
-
129
-
130
-
131
-
132
-
133
-
134
-
135
-
136
-
137
-
138
-
139
-
140
-
141
-
142
-
143
-
144
-
145
-
146
-
147
-
148
-
149
-
150
-
151
-
152
-
153
-
154
-
155
-
156
-
157
-
158
-
159
-
160
-
161
-
162
-
163
-
164
-
165
-
166
-
167
-
168
-
169
-
170
-
171
-
172
-
173
-
174
-
175
-
176
-
177
-
178
-
179
-
180
-
181
-
182
-
183
-
184
-
185
-
186
-
187
-
188
-
189
-
190
-
191
-
192
-
193
-
194
-
195
-
196
-
197
-
198
-
199
-
200
-
201
-
202
-
203
-
204
-
205
-
206
-
207
-
208
-
209
-
210
-
211
-
212
-
213
-
214
-
215
-
216
-
217
-
218
-
219
-
220
-
221
-
222
-
223
-
224
-
225
-
226
-
227
-
228
-
229
-
230
-
231
-
232
-
233
-
234
-
235
-
236
-
237
-
238
-
239
-
240
-
241
-
242
-
243
-
244
-
245
-
246
-
247
-
248
-
249
-
250
-
251
-
252
-
253
-
254
-
255
-
256
-
257
-
258
-
259
-
260
-
261
-
262
-
263
-
264
-
265
-
266
-
267
-
268
-
269
-
270
-
271
-
272
-
273
-
274
-
275
-
276
-
277
-
278
-
279
-
280
-
281
-
282
-
283
-
284
-
285
-
286
-
287
-
288
-
289
-
290
-
291
-
292
-
293
-
294
-
295
-
296
-
297
-
298
-
299
-
300
-
301
-
302
-
303
-
304
-
305
-
306
-
307
-
308
-
309
-
310
-
311
-
312
-
313
-
314
-
315
-
316
-
317
-
318
-
319
-
320
-
321
-
322
-
323
-
324
-
325
-
326
-
327
-
328
-
329
-
330
-
331
-
332
-
333
-
334
-
335
-
336
-
337
-
338
-
339
-
340
-
341
-
342
-
343
-
344
-
345
-
346
-
347
-
348
-
349
-
350
-
351
-
352
-
353
-
354
-
355
-
356
-
357
-
358
-
359
-
360
-
361
-
362
-
363
-
364
-
365
-
366
-
367
-
368
-
369
-
370
-
371
-
372
-
373
-
374
-
375
-
376
-
377
-
378
-
379
-
380
-
381
-
382
-
383
-
384
-
385
-
386
-
387
-
388
-
389
-
390
-
391
-
392
-
393
-
394
-
395
-
396
-
397
-
398
-
399
-
400
-
401
-
402
-
403
-
404
-
405
-
406
-
407
-
408
-
409
-
410
-
411
-
412
-
413
-
414
-
415
-
416
-
417
-
418
-
419
-
420
-
421
-
422
-
423
-
424
-
425
-
426
-
427
-
428
-
429
-
430
-
431
-
432
-
433
-
434
-
435
-
436
-
437
-
438
-
439
-
440
-
441
-
442
-
443
-
444
-
445
-
446
-
447
-
448
-
449
-
450
-
451
-
452
-
453
-
454
-
455
-
456
-
457
-
458
-
459
-
460
-
461
-
462
-
463
-
464
-
465
-
466
-
467
-
468
-
469
-
470
-
471
-
472
-
473
-
474
-
475
-
476
-
477
-
478
-
479
-
480
-
481
-
482
-
483
-
484
-
485
-
486
-
487
-
488
-
489
-
490
-
491
-
492
-
493
-
494
-
495
-
496
-
497
-
498
-
499
-
500
-
501
-
502
-
503
-
504
-
505
-
506
-
507
-
508
-
509
-
510
-
511
-
512
-
513
-
514
-
515
-
516
-
517
-
518
-
519
-
520
-
521
-
522
-
523
-
524
-
525
-
526
-
527
-
528
-
529
-
530
-
531
-
532
-
533
-
534
-
535
-
536
-
537
-
538
-
539
-
540
-
541
-
542
-
543
-
544
-
545
-
546
-
547
-
548
-
549
-
550
-
551
-
552
-
553
-
554
-
555
-
556
-
557
-
558
-
559
-
560
-
561
-
562
-
563
-
564
 |
 |

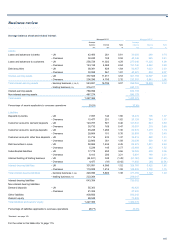
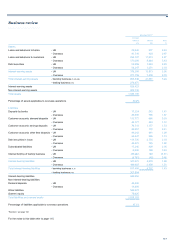
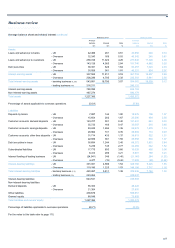
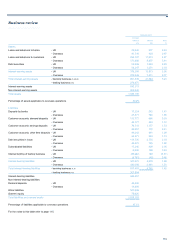
Business review
114
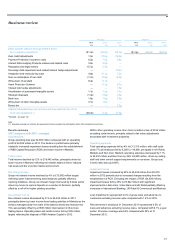
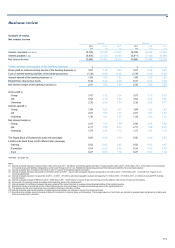
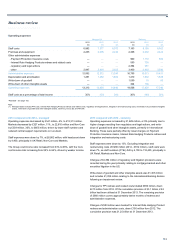
Results summary continued
Tax
The tax charge was £441 million in 2012, compared with £1,075 million in
2011. The high tax charge in the year reflects profits in high tax regimes
(principally US) and losses in low tax regimes (principally Ireland), losses
in overseas subsidiaries for which a deferred tax asset has not been
recognised (principally Ireland), the reduction in the carrying value of
deferred tax assets in Ireland in view of continuing losses, the reduction
in the carrying value of deferred tax assets in Australia following the
strategic changes to the Markets and International Banking businesses
announced in January 2012 and the effect of the two reductions of 1% in
the rate of UK corporation tax enacted in March 2012 and July 2012 on
the net deferred tax balance.
Earnings per share
Basic loss from continuing operations was 54.5p per ordinary and
equivalent B share compared with a loss of 22.7p in 2011. Adjusted
earnings from continuing operations was 4.3p per ordinary and equivalent
B share compared with a loss of 2.7p in 2011.
2012 compared with 2011 - statutory
Operating loss
Operating loss before tax for the year was £5,277 million compared with
£1,396 million in 2011.
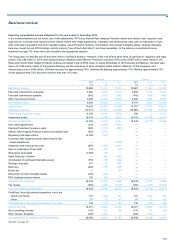
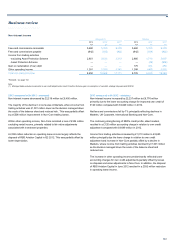
Total income
Total income decreased 27% to £17,941 million in 2012.
Net interest income
Net interest income decreased by 7% to £11,402 million.
Non-interest income
Non-interest income decreased to £6,539 million from £12,348 million in
2011. This included movements in the fair value of the Asset Protection
Scheme resulting in a £44 million charge (2011 - £906 million), net gain
on redemption of own debt of £454 million (2011 - £255 million) and a
loss on own credit adjustments of £4,649 million (2011 - £1,914 million
gain). Excluding these items, non-interest income was down 3%
compared with 2011.
Operating expenses
Operating expenses increased to £17,939 million from £17,340 million in
2011. This included PPI costs of £1,110 million (2011 - £850 million),
IRHP redress and related costs of £700 million, regulatory fines of £381
million, integration and restructuring costs of £1,415 million compared
with £1,016 million in 2011, and write-down of goodwill and other
intangible assets of £124 million, principally as a result of exits from
selective countries and lower revenue projections by Markets. Excluding
these items, operating expenses were down 8% driven by cost savings
achieved as a result of the cost reduction programme.
Impairment losses
Impairment losses were £5,279 million, compared with £8,707 million in
2011.
Risk elements in lending represented 9.1% of gross loans and advances
to customers excluding reverse repos at 31 December 2012 (2011 -
8.6%).
Provision coverage of risk elements in lending was 52% (2011 - 49%).
Tax
The tax charge for 2012 was £441 million (2011 - £1,075 million).
Loss per share
Basic loss per ordinary and equivalent B share from continuing
operations was 54.5p per share compared with 22.7p per share in 2011.