RBS 2013 Annual Report Download - page 202
Download and view the complete annual report
Please find page 202 of the 2013 RBS annual report below. You can navigate through the pages in the report by either clicking on the pages listed below, or by using the keyword search tool below to find specific information within the annual report.-
 1
1 -
2
-
3
-
4
-
5
-
6
-
7
-
8
-
9
-
10
-
11
-
12
-
13
-
14
-
15
-
16
-
17
-
18
-
19
-
20
-
21
-
22
-
23
-
24
-
25
-
26
-
27
-
28
-
29
-
30
-
31
-
32
-
33
-
34
-
35
-
36
-
37
-
38
-
39
-
40
-
41
-
42
-
43
-
44
-
45
-
46
-
47
-
48
-
49
-
50
-
51
-
52
-
53
-
54
-
55
-
56
-
57
-
58
-
59
-
60
-
61
-
62
-
63
-
64
-
65
-
66
-
67
-
68
-
69
-
70
-
71
-
72
-
73
-
74
-
75
-
76
-
77
-
78
-
79
-
80
-
81
-
82
-
83
-
84
-
85
-
86
-
87
-
88
-
89
-
90
-
91
-
92
-
93
-
94
-
95
-
96
-
97
-
98
-
99
-
100
-
101
-
102
-
103
-
104
-
105
-
106
-
107
-
108
-
109
-
110
-
111
-
112
-
113
-
114
-
115
-
116
-
117
-
118
-
119
-
120
-
121
-
122
-
123
-
124
-
125
-
126
-
127
-
128
-
129
-
130
-
131
-
132
-
133
-
134
-
135
-
136
-
137
-
138
-
139
-
140
-
141
-
142
-
143
-
144
-
145
-
146
-
147
-
148
-
149
-
150
-
151
-
152
-
153
-
154
-
155
-
156
-
157
-
158
-
159
-
160
-
161
-
162
-
163
-
164
-
165
-
166
-
167
-
168
-
169
-
170
-
171
-
172
-
173
-
174
-
175
-
176
-
177
-
178
-
179
-
180
-
181
-
182
-
183
-
184
-
185
-
186
-
187
-
188
-
189
-
190
-
191
-
 192
192 -
 193
193 -
 194
194 -
 195
195 -
 196
196 -
 197
197 -
 198
198 -
 199
199 -
 200
200 -
 201
201 -
 202
202 -
 203
203 -
 204
204 -
 205
205 -
 206
206 -
 207
207 -
 208
208 -
 209
209 -
 210
210 -
 211
211 -
 212
212 -
213
-
214
-
215
-
216
-
217
-
218
-
219
-
220
-
221
-
222
-
223
-
224
-
225
-
226
-
227
-
228
-
229
-
230
-
231
-
232
-
233
-
234
-
235
-
236
-
237
-
238
-
239
-
240
-
241
-
242
-
243
-
244
-
245
-
246
-
247
-
248
-
249
-
250
-
251
-
252
-
253
-
254
-
255
-
256
-
257
-
258
-
259
-
260
-
261
-
262
-
263
-
264
-
265
-
266
-
267
-
268
-
269
-
270
-
271
-
272
-
273
-
274
-
275
-
276
-
277
-
278
-
279
-
280
-
281
-
282
-
283
-
284
-
285
-
286
-
287
-
288
-
289
-
290
-
291
-
292
-
293
-
294
-
295
-
296
-
297
-
298
-
299
-
300
-
301
-
302
-
303
-
304
-
305
-
306
-
307
-
308
-
309
-
310
-
311
-
312
-
313
-
314
-
315
-
316
-
317
-
318
-
319
-
320
-
321
-
322
-
323
-
324
-
325
-
326
-
327
-
328
-
329
-
330
-
331
-
332
-
333
-
334
-
335
-
336
-
337
-
338
-
339
-
340
-
341
-
342
-
343
-
344
-
345
-
346
-
347
-
348
-
349
-
350
-
351
-
352
-
353
-
354
-
355
-
356
-
357
-
358
-
359
-
360
-
361
-
362
-
363
-
364
-
365
-
366
-
367
-
368
-
369
-
370
-
371
-
372
-
373
-
374
-
375
-
376
-
377
-
378
-
379
-
380
-
381
-
382
-
383
-
384
-
385
-
386
-
387
-
388
-
389
-
390
-
391
-
392
-
393
-
394
-
395
-
396
-
397
-
398
-
399
-
400
-
401
-
402
-
403
-
404
-
405
-
406
-
407
-
408
-
409
-
410
-
411
-
412
-
413
-
414
-
415
-
416
-
417
-
418
-
419
-
420
-
421
-
422
-
423
-
424
-
425
-
426
-
427
-
428
-
429
-
430
-
431
-
432
-
433
-
434
-
435
-
436
-
437
-
438
-
439
-
440
-
441
-
442
-
443
-
444
-
445
-
446
-
447
-
448
-
449
-
450
-
451
-
452
-
453
-
454
-
455
-
456
-
457
-
458
-
459
-
460
-
461
-
462
-
463
-
464
-
465
-
466
-
467
-
468
-
469
-
470
-
471
-
472
-
473
-
474
-
475
-
476
-
477
-
478
-
479
-
480
-
481
-
482
-
483
-
484
-
485
-
486
-
487
-
488
-
489
-
490
-
491
-
492
-
493
-
494
-
495
-
496
-
497
-
498
-
499
-
500
-
501
-
502
-
503
-
504
-
505
-
506
-
507
-
508
-
509
-
510
-
511
-
512
-
513
-
514
-
515
-
516
-
517
-
518
-
519
-
520
-
521
-
522
-
523
-
524
-
525
-
526
-
527
-
528
-
529
-
530
-
531
-
532
-
533
-
534
-
535
-
536
-
537
-
538
-
539
-
540
-
541
-
542
-
543
-
544
-
545
-
546
-
547
-
548
-
549
-
550
-
551
-
552
-
553
-
554
-
555
-
556
-
557
-
558
-
559
-
560
-
561
-
562
-
563
-
564
 |
 |

Business review Risk and balance sheet management
200
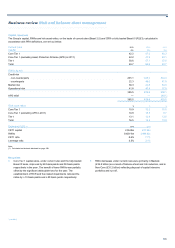
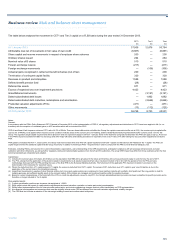
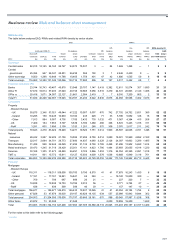
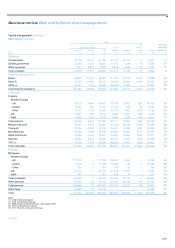
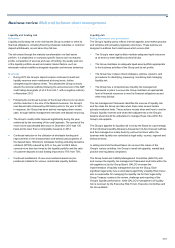
Capital management* continued
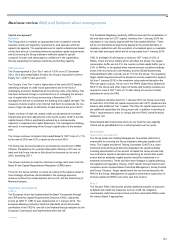
Estimated leverage ratio
The Basel III agreement introduced a leverage ratio as a non-risk based
backstop limit intended to supplement the risk-based capital
requirements. It aims to constrain the build up of excess leverage in the
banking sector, introducing additional safeguards against model risk and
measurement errors.
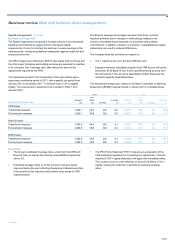
The PRA’s Supervisory Statement SS3/13 also states that the Group and
the other major UK banks and building societies are expected to maintain
a 3% end point Tier 1 leverage ratio, after taking into account the
adjustments required by the PRA.
The transitional period for the introduction of this ratio started with a
supervisory monitoring period in 2011, with a parallel run period from
January 2013 to December 2017. A minimum ratio of 3% is applied
initially. The requirement is expected to be included in Pillar 1 from
January 2018.
The Basel III leverage percentages are lower than those currently
reported, primarily due to changes in methodology relating to the
inclusion of potential future exposure on derivatives and undrawn
commitments. In addition, inclusion or exclusion of grandfathered capital
instruments can result in material differences.
The leverage ratios set out below are based on:
• Tier 1 capital as set out in the final CRR text; and
• Exposure measure calculated using the final CRR text as well as the
December 2010 Basel III text; further specificity being sourced from
the instructions in the July 2012 Quantitative Impact Study and the
related Frequently Asked Questions.
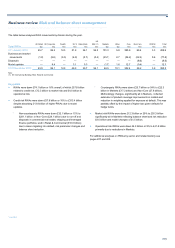
The estimated leverage ratio, based on the Basel Committee on Banking
Supervision (BCBS) proposal issued in January 2014, is detailed below.
2013 2012
Tier 1 Tier 1
Exposure capital Leverage Exposure capital Leverage
Estimated leverage ratio £bn £bn Leverage % £bn £bn Leverage %
CRR basis:
Transitional measure 1,062.1 44.3 24x 4.2 1,205.2 54.0 22x 4.5
Full end point measure 1,062.1 36.8 29x 3.5 1,202.3 37.9 32x 3.1
Basel III basis:
Transitional measure 1,093.5 44.3 25x 4.1 1,225.8 54.0 23x 4.4
Full end point measure 1,093.5 36.8 30x 3.4 1,222.9 37.9 32x 3.1
BCBS basis:
Transitional measure 1,082.0 44.3 24x 4.1 1,239.8 54.0 23x 4.4
Full end point measure 1,082.0 36.8 29x 3.4 1,236.9 37.9 33x 3.1
Key points
• The Group’s estimated leverage ratios, under both the CRR and
Basel III texts, as well as the recently issued BCBS proposal are
above 3%.
• Estimated leverage ratios on all full end point measure bases
improved during the year reflecting downsizing in Markets and Non-
Core as well as risk reduction and portfolio focus ahead of CRR
implementation.
• The PRA Policy Statement PS7/13 requires an acceleration of the
CRR transitional approach for computing the capital base. Thus the
majority of CET1 capital deductions will apply with immediate effect.
This causes a year-on-year reduction of around £10 billion in Tier 1
capital, causing the reduction in transitional measure leverage
ratios.
*unaudited