Public Storage 2015 Annual Report Download - page 6
Download and view the complete annual report
Please find page 6 of the 2015 Public Storage annual report below. You can navigate through the pages in the report by either clicking on the pages listed below, or by using the keyword search tool below to find specific information within the annual report.-
 1
1 -
 2
2 -
 3
3 -
 4
4 -
 5
5 -
 6
6 -
 7
7 -
 8
8 -
 9
9 -
 10
10 -
 11
11 -
 12
12 -
 13
13 -
 14
14 -
 15
15 -
 16
16 -
 17
17 -
18
-
19
-
20
-
21
-
22
-
23
-
24
-
25
-
26
-
27
-
28
-
29
-
30
-
31
-
32
-
33
-
34
-
35
-
36
-
37
-
38
-
39
-
40
-
41
-
42
-
43
-
44
-
45
-
46
-
47
-
48
-
49
-
50
-
51
-
52
-
53
-
54
-
55
-
56
-
57
-
58
-
59
-
60
-
61
-
62
-
63
-
64
-
65
-
66
-
67
-
68
-
69
-
70
-
71
-
72
-
73
-
74
-
75
-
76
-
77
-
78
-
79
-
80
-
81
-
82
-
83
-
84
-
85
-
86
-
87
-
88
-
89
-
90
-
91
-
92
-
93
-
94
-
95
-
96
-
97
-
98
-
99
-
100
-
101
-
102
-
103
-
104
-
105
-
106
-
107
-
108
-
109
-
110
-
111
-
112
-
113
-
114
-
115
-
116
-
117
-
118
-
119
-
120
-
121
-
122
-
123
-
124
-
125
-
126
-
127
-
128
-
129
-
130
-
131
-
132
-
133
-
134
-
135
-
136
-
137
-
138
-
139
-
140
-
141
-
142
-
143
-
144
 |
 |

3
So how does Public Storage stack up against other S&P 500 companies? Over the past ten years, S&P 500
companies increased earnings per share on average 3.5% per year
2
and dividends by 5.1% per year.
3
Dividends increased faster than earnings in part due to share repurchases, which were almost $4 trillion
4
over
this period. Share repurchases have averaged around 3% of the S&P 500 companies’ market value each year
so ten years of repurchases equates to over 20% of the index.
Over the past decade, Public Storage has deleveraged its balance sheet while earnings (core funds from
operations) and dividends have grown at compounded rates of 9.2% and 13.1% per year, respectively. Total
return to Public Storage shareholders has been about 17% per year compared with 7% for the S&P 500 Index.
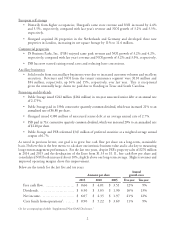
U.S. Self-Storage
Our U.S. self-storage business generated 94% of reported consolidated revenues and 85% of our net
operating income. With 2,300 properties, we are larger than our top three competitors combined. We
operate under the Public Storage brand, the most well-known and only “brand” in the industry. While
metropolitan centers where most of our properties are located.
Public Storage’s Market Share Estimates
by selected Metropolitan Statistical Areas (MSA)
Next largest Annual
Percentage of competitor’s population growth
MSA 2015 NOI Market share5 share 2010-2015
Los Angeles 14.4% 21.0% 6.6% 1.1%
Miami 6.9% 24.7% 7.2% 1.2%
New York 6.2% 10.9% 7.3% 1.0%
San Francisco 5.9% 22.8% 5.2% 1.0%
Washington DC 4.9% 21.0% 9.5% 1.6%
Seattle 4.6% 18.8% 1.2% 1.3%
Dallas-Ft.Worth 3.6% 12.2% 6.1% 1.5%
Houston 3.6% 13.0% 6.7% 1.5%
Atlanta 3.5% 15.6% 6.7% 1.3%
San Jose 2.8% 28.1% 5.2% 1.4%
Denver 2.3% 20.9% 7.2% 1.3%
Minneapolis 1.8% 20.9% 0.4% 1.1%
Charlotte 1.8% 18.0% 2.6% 1.4%
Orlando 1.7% 21.9% 4.1% 1.4%
Austin 1.3% 11.3% 6.0% 1.7%
We continue to invest in the larger, faster growing MSAs. Our business requires people and activity, so
MSAs with population inflows, greater density and better incomes generally have higher growth rates.
Greater market share creates better product/brand awareness and improves our operating efficiencies.
(2) “S&P 500 Earnings by Year,” www.multpl.com/s-p-500-earnings/table
(3) “S&P 500 Dividend by Year,” www.multpl.com/s-p-500-dividend/table
(5) Public Storage’s wholly-owned properties as a percentage of total properties in the MSA using data sourced from Nielson