Public Storage 2015 Annual Report Download - page 5
Download and view the complete annual report
Please find page 5 of the 2015 Public Storage annual report below. You can navigate through the pages in the report by either clicking on the pages listed below, or by using the keyword search tool below to find specific information within the annual report.-
 1
1 -
 2
2 -
 3
3 -
 4
4 -
 5
5 -
 6
6 -
 7
7 -
 8
8 -
 9
9 -
 10
10 -
 11
11 -
 12
12 -
 13
13 -
 14
14 -
 15
15 -
 16
16 -
17
-
18
-
19
-
20
-
21
-
22
-
23
-
24
-
25
-
26
-
27
-
28
-
29
-
30
-
31
-
32
-
33
-
34
-
35
-
36
-
37
-
38
-
39
-
40
-
41
-
42
-
43
-
44
-
45
-
46
-
47
-
48
-
49
-
50
-
51
-
52
-
53
-
54
-
55
-
56
-
57
-
58
-
59
-
60
-
61
-
62
-
63
-
64
-
65
-
66
-
67
-
68
-
69
-
70
-
71
-
72
-
73
-
74
-
75
-
76
-
77
-
78
-
79
-
80
-
81
-
82
-
83
-
84
-
85
-
86
-
87
-
88
-
89
-
90
-
91
-
92
-
93
-
94
-
95
-
96
-
97
-
98
-
99
-
100
-
101
-
102
-
103
-
104
-
105
-
106
-
107
-
108
-
109
-
110
-
111
-
112
-
113
-
114
-
115
-
116
-
117
-
118
-
119
-
120
-
121
-
122
-
123
-
124
-
125
-
126
-
127
-
128
-
129
-
130
-
131
-
132
-
133
-
134
-
135
-
136
-
137
-
138
-
139
-
140
-
141
-
142
-
143
-
144
 |
 |

2
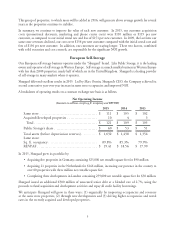
European self-storage
and 5.5%, respectively, compared with last year’s revenue and NOI growth of 3.2% and 3.5%,
respectively.
properties in London, increasing its net square footage by 11% to 11.6 million.
Commercial properties
respectively, compared with last year’s revenue and NOI growth of 3.2% and 3.0%, respectively.
Ancillary businesses
execution. Revenues and NOI from the tenant reinsurance segment were $110 million and
$84 million, respectively, up 16% and 15%, respectively, over last year. This is exceptional
given the unusually large claims we paid due to flooding in Texas and South Carolina.
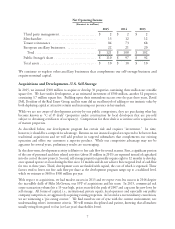
Financing and dividends
of 2.175%.
annualized rate of $6.80 per share.
of $2.40 per share.
coupon of 6.7%.
As noted in previous letters, our goal is to grow free cash flow per share on a long-term, sustainable
basis. I believe this is the best metric to calculate our intrinsic business value and is also key to measuring
in 2014 and 2015 and the devaluation of the Euro from $1.33 to $1.11, free cash flow per share and
consolidated NOI both increased about 10%, slightly above our long-term average. Higher revenues and
improved operating margins drove this improvement.
Annual
Amounts per share growth rates
2015 2010 2005 Five-year Ten-year
Free cash flow $ 8.66 $ 4.81 $ 3.51 12% 9%
Dividends $ 6.50 $ 3.05 $ 1.90 16% 13%
Net income $ 6.07 $ 2.35 $ 1.97 21% 12%
Core funds from operations1 $ 8.90 $ 5.22 $ 3.69 11% 9%
(1) See accompanying schedule “Supplemental Non-GAAP Disclosures.”