Public Storage 2015 Annual Report Download - page 4
Download and view the complete annual report
Please find page 4 of the 2015 Public Storage annual report below. You can navigate through the pages in the report by either clicking on the pages listed below, or by using the keyword search tool below to find specific information within the annual report.-
 1
1 -
 2
2 -
 3
3 -
 4
4 -
 5
5 -
 6
6 -
 7
7 -
 8
8 -
 9
9 -
 10
10 -
 11
11 -
 12
12 -
 13
13 -
 14
14 -
 15
15 -
16
-
17
-
18
-
19
-
20
-
21
-
22
-
23
-
24
-
25
-
26
-
27
-
28
-
29
-
30
-
31
-
32
-
33
-
34
-
35
-
36
-
37
-
38
-
39
-
40
-
41
-
42
-
43
-
44
-
45
-
46
-
47
-
48
-
49
-
50
-
51
-
52
-
53
-
54
-
55
-
56
-
57
-
58
-
59
-
60
-
61
-
62
-
63
-
64
-
65
-
66
-
67
-
68
-
69
-
70
-
71
-
72
-
73
-
74
-
75
-
76
-
77
-
78
-
79
-
80
-
81
-
82
-
83
-
84
-
85
-
86
-
87
-
88
-
89
-
90
-
91
-
92
-
93
-
94
-
95
-
96
-
97
-
98
-
99
-
100
-
101
-
102
-
103
-
104
-
105
-
106
-
107
-
108
-
109
-
110
-
111
-
112
-
113
-
114
-
115
-
116
-
117
-
118
-
119
-
120
-
121
-
122
-
123
-
124
-
125
-
126
-
127
-
128
-
129
-
130
-
131
-
132
-
133
-
134
-
135
-
136
-
137
-
138
-
139
-
140
-
141
-
142
-
143
-
144
 |
 |

1
To the Shareholders of Public Storage:
(1) See accompanying schedule “Supplemental Non-GAAP Disclosures.”
Public Storage’s businesses generated improved operating results in 2015. Our management teams produced
excellent results for shareholders and our competitive position and financial strength improved. We are well
positioned for 2016.
Here are the key figures for our businesses. They are presented as if Public Storage owned 100% of each to better
understand the business results.
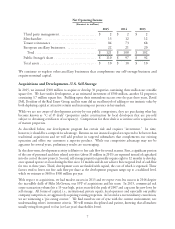
(Amounts in millions)
Revenues1
2015 2014 2013
U.S. self-storage $ 2,236 $ 2,050 $ 1,850
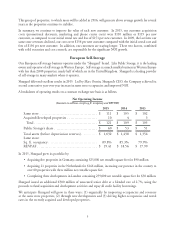
European self-storage 210 189 183
Commercial properties 388 393 374
Ancillary businesses 175 154 141
Total $ 3,009 $ 2,786 $ 2,548
Net Operating Income (NOI)1
2015 2014 2013
U.S. self-storage $ 1,649 $ 1,483 $ 1,326
European self-storage 121 109 105
Commercial properties 264 262 250
Ancillary businesses 121 108 102
Total $ 2,155 $ 1,962 $ 1,783
Public Storage’s share $ 1,936 $ 1,750 $ 1,579
Overall, our combined revenues increased to $3.0 billion from $2.8 billion. Most of this incremental
revenue flowed to the bottom line resulting in a higher NOI of $193 million and free cash flow per
share1 of $8.66, up 12% from $7.73 in 2014.
Key 2015 Highlights
U.S. self-storage
grew by 6.5% and 8.5%, respectively, compared with last year’s revenue and NOI growth of 5.5%
and 6.9%, respectively.
three million net rentable square feet. We ended 2015 with 32 properties under development
with an estimated investment of $500 million.