Progressive 2012 Annual Report Download - page 16
Download and view the complete annual report
Please find page 16 of the 2012 Progressive annual report below. You can navigate through the pages in the report by either clicking on the pages listed below, or by using the keyword search tool below to find specific information within the annual report.-
 1
1 -
2
-
3
-
4
-
5
-
 6
6 -
 7
7 -
 8
8 -
 9
9 -
 10
10 -
 11
11 -
 12
12 -
 13
13 -
 14
14 -
 15
15 -
 16
16 -
 17
17 -
 18
18 -
 19
19 -
 20
20 -
 21
21 -
 22
22 -
 23
23 -
 24
24 -
 25
25 -
 26
26 -
27
-
28
-
29
-
30
-
31
-
32
-
33
-
34
-
35
-
36
-
37
-
38
-
39
-
40
-
41
-
42
-
43
-
44
-
45
-
46
-
47
-
48
-
49
-
50
-
51
-
52
-
53
-
54
-
55
-
56
-
57
-
58
-
59
-
60
-
61
-
62
-
63
-
64
-
65
-
66
-
67
-
68
-
69
-
70
-
71
-
72
-
73
-
74
-
75
-
76
-
77
-
78
-
79
-
80
-
81
-
82
-
83
-
84
-
85
-
86
-
87
-
88
 |
 |

Gross realized gains and losses were the result of sales transactions in our fixed-income portfolio, related to movements in
credit spreads and interest rates, rebalancing of our equity-indexed portfolio, and tax management strategies. In addition,
gains and losses reflect recoveries from litigation settlements and holding period valuation changes on hybrids and
derivatives. Also included are write-downs for securities determined to be other-than-temporarily impaired in our fixed-
maturity and/or equity portfolios.
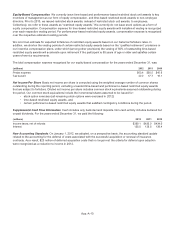
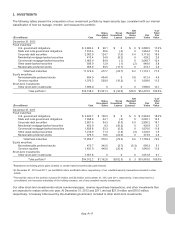
Net Investment Income The components of net investment income for the years ended December 31, were:
(millions) 2012 2011 2010
Fixed maturities:
U.S. government obligations $ 49.8 $ 58.0 $ 80.8
State and local government obligations 51.1 60.0 65.4
Corporate debt securities 107.5 106.7 84.3
Residential mortgage-backed securities 16.1 18.6 21.7
Commercial mortgage-backed securities 82.2 83.4 99.1
Other asset-backed securities 20.3 24.5 21.8
Redeemable preferred stocks 24.2 33.0 45.5
Total fixed maturities 351.2 384.2 418.6
Equity securities:
Nonredeemable preferred stocks 43.8 57.7 70.6
Common equities 44.9 35.7 27.3
Short-term investments:
Other short-term investments 3.1 2.4 3.6
Investment income 443.0 480.0 520.1
Investment expenses (15.4) (13.5) (11.9)
Net investment income $427.6 $466.5 $508.2
Trading Securities At December 31, 2012 and 2011, we did not hold any trading securities and we did not have any net
realized gains (losses) on trading securities for the years ended December 31, 2012, 2011, and 2010.
Derivative Instruments We have invested in the following derivative exposures at various times: interest rate swaps,
asset-backed credit default swaps, U.S. corporate credit default swaps, cash flow hedges, and equity options.
For all derivative positions discussed below, realized holding period gains and losses are netted with any upfront cash that
may be exchanged under the contract to determine if the net position should be classified either as an asset or liability. To
be reported as a net derivative asset and a component of the available-for-sale portfolio, the inception-to-date realized gain
on the derivative position at period end would have to exceed any upfront cash received. On the other hand, a net derivative
liability would include any inception-to-date realized loss plus the amount of upfront cash received (or netted, if upfront cash
was paid) and would be reported as a component of other liabilities. These net derivative assets/liabilities are not separately
disclosed on the balance sheet due to their immaterial effect on our financial condition, cash flows, and results of
operations.
App.-A-16