Progressive 2012 Annual Report Download - page 15
Download and view the complete annual report
Please find page 15 of the 2012 Progressive annual report below. You can navigate through the pages in the report by either clicking on the pages listed below, or by using the keyword search tool below to find specific information within the annual report.-
 1
1 -
2
-
3
-
4
-
 5
5 -
 6
6 -
 7
7 -
 8
8 -
 9
9 -
 10
10 -
 11
11 -
 12
12 -
 13
13 -
 14
14 -
 15
15 -
 16
16 -
 17
17 -
 18
18 -
 19
19 -
 20
20 -
 21
21 -
 22
22 -
 23
23 -
 24
24 -
 25
25 -
26
-
27
-
28
-
29
-
30
-
31
-
32
-
33
-
34
-
35
-
36
-
37
-
38
-
39
-
40
-
41
-
42
-
43
-
44
-
45
-
46
-
47
-
48
-
49
-
50
-
51
-
52
-
53
-
54
-
55
-
56
-
57
-
58
-
59
-
60
-
61
-
62
-
63
-
64
-
65
-
66
-
67
-
68
-
69
-
70
-
71
-
72
-
73
-
74
-
75
-
76
-
77
-
78
-
79
-
80
-
81
-
82
-
83
-
84
-
85
-
86
-
87
-
88
 |
 |

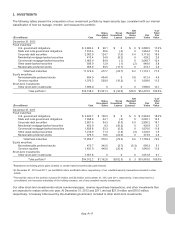
Net Realized Gains (Losses) The components of net realized gains (losses) for the years ended December 31, were:
(millions) 2012 2011 2010
Gross realized gains on security sales
Fixed maturities:
U.S. government obligations $ 20.2 $ 59.1 $ 39.8
State and local government obligations 15.0 3.5 10.0
Corporate and other debt securities 58.1 23.0 30.3
Residential mortgage-backed securities 1.2 2.0 0
Commercial mortgage-backed securities 19.3 .3 1.0
Other asset-backed securities .9 2.1 .8
Redeemable preferred stocks .7 4.6 8.5
Total fixed maturities 115.4 94.6 90.4
Equity securities:
Nonredeemable preferred stocks 78.2 148.9 83.6
Common equities 167.0 11.6 13.4
Subtotal gross realized gains on security sales 360.6 255.1 187.4
Gross realized losses on security sales
Fixed maturities:
U.S. government obligations (1.9) (9.3) (12.9)
Corporate and other debt securities (.6) (3.5) (.5)
Redeemable preferred stocks (.4) (2.2) (5.2)
Total fixed maturities (2.9) (15.0) (18.6)
Equity securities:
Nonredeemable preferred stocks (1.1) 0 0
Common equities (27.1) (36.5) (7.2)
Subtotal gross realized losses on security sales (31.1) (51.5) (25.8)
Net realized gains (losses) on security sales
Fixed maturities:
U.S. government obligations 18.3 49.8 26.9
State and local government obligations 15.0 3.5 10.0
Corporate and other debt securities 57.5 19.5 29.8
Residential mortgage-backed securities 1.2 2.0 0
Commercial mortgage-backed securities 19.3 .3 1.0
Other asset-backed securities .9 2.1 .8
Redeemable preferred stocks .3 2.4 3.3
Total fixed maturities 112.5 79.6 71.8
Equity securities:
Nonredeemable preferred stocks 77.1 148.9 83.6
Common equities 139.9 (24.9) 6.2
Subtotal net realized gains (losses) on security sales 329.5 203.6 161.6
Other-than-temporary impairment losses
Fixed maturities:
Residential mortgage-backed securities (1.6) (3.3) (11.1)
Commercial mortgage-backed securities (.1) (.6) (1.9)
Total fixed maturities (1.7) (3.9) (13.0)
Equity securities:
Common equities (1.8) (.2) (.5)
Subtotal other-than-temporary impairment losses (3.5) (4.1) (13.5)
Other gains (losses)
Hybrid securities 14.3 1.7 5.5
Derivative instruments (43.1) (98.9) (58.5)
Litigation settlements 9.6 .3 1.0
Subtotal other gains (losses) (19.2) (96.9) (52.0)
Total net realized gains (losses) on securities $306.8 $102.6 $ 96.1
App.-A-15