Progressive 2012 Annual Report Download
Download and view the complete annual report
Please find the complete 2012 Progressive annual report below. You can navigate through the pages in the report by either clicking on the pages listed below, or by using the keyword search tool below to find specific information within the annual report.-
 1
1 -
 2
2 -
 3
3 -
 4
4 -
 5
5 -
 6
6 -
 7
7 -
 8
8 -
 9
9 -
 10
10 -
 11
11 -
 12
12 -
13
-
14
-
15
-
16
-
17
-
18
-
19
-
20
-
21
-
22
-
23
-
24
-
25
-
26
-
27
-
28
-
29
-
30
-
31
-
32
-
33
-
34
-
35
-
36
-
37
-
38
-
39
-
40
-
41
-
42
-
43
-
44
-
45
-
46
-
47
-
48
-
49
-
50
-
51
-
52
-
53
-
54
-
55
-
56
-
57
-
58
-
59
-
60
-
61
-
62
-
63
-
64
-
65
-
66
-
67
-
68
-
69
-
70
-
71
-
72
-
73
-
74
-
75
-
76
-
77
-
78
-
79
-
80
-
81
-
82
-
83
-
84
-
85
-
86
-
87
-
88
 |
 |

s 50 mph 10/04/12 11:11 PM 1.87 miles 35 mph 10/05/12 1:31 PM 00.95 miles 33 mph 10/05/12 2:34 PM 0.01 miles 6 mph 10/05/12 5:57 PM 0.92 miles 32 mph 10/05/12 9:50 PM 0
M 1.41 miles 39 mph 10/06/12 3:25 PM 0.36 miles 39 mph 10/06/12 3:28 PM 6.42 miles 45 mph 10/06/12 4:53 PM 6.67 miles 42 mph 10/06/12 6:43 PM 7.96 miles 45 mph 10/06/
8/12 7:40 AM 0.43 miles 32 mph 10/08/12 2:36 PM 7.98 miles 44 mph 10/09/12 6:02 AM 7.97 miles 47 mph 10/09/12 7:37 AM 0.74 miles 36 mph 10/09/12 7:46 AM 0.78 miles 3
ph 10/09/12 5:13 PM 0.01 miles 3mph 10/09/12 5:46 PM 0.65 miles 35 mph 10/09/12 7:03 PM 1.02 miles 29 mph 10/09/12 7:22 PM 0.02 miles 6 mph 10/09/12 7:24 PM 0.68 mil
0/12 7:45 AM 0.79 miles 33 mph 10/10/12 2:25 PM 0.87 miles 38 mph 10/10/12 2:36 PM 2.10 miles 42 mph 10/10/12 2:45 PM 4.98 miles 48 mph 10/10/12 4:08 PM 0.67 miles 36 m
1 miles 8 mph 10/10/12 11:18 PM 2.19 miles 48 mph 10/11/12 12:50 PM 7.71 miles 62 mph 10/11/12 3:24 PM 2.34 miles 47 mph 10/11/12 3:40 PM 2.32 miles 47 mph 10/11/12 6:
s 45 mph 10/11/12 10:20 PM 0.01 miles 7 mph 10/11/12 10:50 PM 4.9 miles 58 mph 10/12/12 10:12 AM 1.27 miles 32 mph 10/12/12 10:40 AM 2.19 miles 45 mph 10/12/12 11:27 A
ph 10/12/12 6:00 PM 0.01 miles 5 mph 10/12/12 6:09 PM 0.45 miles 34 mph 10/12/12 6:19 PM 16.09 miles 66 mph 10/13/12 1:40 PM 1.12 35 mph 10/13/12 2:31 PM 1.18 miles 3
2 7:19 PM 1.39 miles 36 mph 10/14/12 6:07 AM 7.95 miles 45 mph 10/17/12 5:13 PM 7.3 miles 45 mph 10/17/12 6:25 PM 10.19 miles 58 mph 10/17/12 7:15 PM 1.27 miles 36 mph 1
h 10/18/12 12:23 AM 0.02 miles 7 mph 10/18/12 11:47 AM 0.95 miles 32 mph 10/18/12 11:53 AM 0.01 miles 6 mph 10/18/12 12:10 PM 0 miles 0 mph 10/18/12 1:16 PM 3.55 mil
:50 PM 7.13 miles 45 mph 10/18/12 10:13 PM 2.94 miles 62 mph 10/18/12 10:33 PM 3.56 miles 53 mph 10/18/12 10:57 PM 0.16 22 mph 10/18/12 11:03 PM 1.2 miles 36 mph 10/
5 PM 0.94 miles 32 mph 10/19/12 2:49 PM 5.62 miles 58 mph 10/19/12 3:30 PM 0.95 miles 32 mph 10/19/12 4:04 PM 1.29 miles 36 mph 10/19/12 4:30 PM 2.53 miles 45 mph 10
6 miles 33 mph 10/03/12 3:15 PM 12.21 miles 52 mph 10/3/12 4:03 PM 6.91 miles 47 mph 10/3/12 6:05 PM 7.15 miles 44 mph 10/3/12 6:22 PM 0.01 miles 5 mph 10/03/12 7:34 P
2 10:45 AM 3.06 miles 39 mph 10/04/12 11:24 AM 7.13 miles 42 mph 10/04/12 12:24 PM 4.66 miles 43 mph 10/4/12 12:39 PM 0 miles 0 mph 10/04/12 12:49 PM 0.01 miles 3 mp
4 PM 16.41 miles 67 mph 10/04/12 8:53 PM 1.65 miles 45 mph 10/04/12 9:04 PM 9.72 miles 52 mph 10/04/12 10:32 PM 10.86 miles 50 mph 10/04/12 11:11 PM 1.87 miles 35 mp
h 10/06/12 7:29 AM 0.92 miles 42 mph 10/06/12 2:39 PM 0.84 miles 39 mph 10/06/12 3:02 PM 7.11 miles 45 mph 10/06/12 3:21 PM 1.41 miles 39 mph 10/06/12 3:25 PM 0.36 mi
M 0.72 miles 29 mph mph 10/07/12 7:50 AM 0.84 miles 31 mph 10/07/12 2:36 PM 7.98 miles 52 mph 10/08/12 6:03 AM 8.19 miles 48 mph 10/08/12 7:40 AM 0.43 miles 32 mph 10
s 41 mph 10/09/12 3:48 PM 3.48 miles 48 mph 10/09/12 3:58 PM 0.67 miles 39 mph 10/09/12 4:06 PM 3.21 miles 47 mph 10/09/12 5:13 PM 0.01 miles 3 mph 10/09/12 5:46 PM 0.
h 10/10/12 6:34 AM 7.97 42 mph 10/10/12 7:24 AM 0.75 miles 32 mph 10/10/12 7:35 AM 0.80 miles 35 mph 10/10/12 7:45 AM 0.79 miles 33 mph 10/10/12 2:25 PM 0.87 miles 38 m
M 4.13 miles 42 mph 10/10/12 9:47 PM 4 miles 47 mph 10/10/12 10:04 PM 6.81 miles 53 mph 10/10/12 10:31 PM 0.01 miles 8 mph 10/10/12 11:18 PM 2.19 miles 48 mph 10/11/1
5 miles 55 mph 10/11/12 7:46 PM 5.87 miles 47 mph 10/11/12 8:17 PM 3.57 miles 47 mph 10/11/12 10:00 PM 6 miles 45 mph 10/11/12 10:20 PM 0.01 miles 7 mph 10/11/12 10:
iles 66 mph 10/12/12 5:04 PM 7.08 miles 62 mph 10/12/12 5:41 PM 2 miles 47 mph 10/12/12 5:52 PM 0.04 miles 12 mph 10/12/12 6:00 PM 0.01 miles 5 mph 10/12/12 6:09 PM 0
h 10/13/12 6:49 PM 3.39 miles 40 mph 10/13/12 7:00 PM 2.16 miles 42 mph 10/13/12 7:07 PM 1.8 miles 32 mph 10/13/12 7:19 PM 1.39 miles 36 mph 10/14/12 6:07 AM 7.95 mile
2 9:54 PM 4.3 miles 60 mph 10/17/12 10:36 PM 2.07 miles 39 mph 10/17/12 11:58 PM 3.99 miles 42 mph 10/18/12 12:23 AM 0.02 miles 7 mph 10/18/12 11:47 AM 0.95 miles 32 m
5 PM 0 miles 0 mph 10/18/12 4:35 PM 2.12 miles 42 mph 10/18/12 5:09 PM 5.62 miles 42 mph 10/18/12 6:50 PM 7.13 miles 45 mph 10/18/12 10:13 PM 2.94 miles 62 mph 10/18/1
58 AM 1.03 miles 39 mph 10/19/12 2:53 AM 1.48 miles 35 mph 10/19/12 2:15 PM 0.94 miles 32 mph 10/19/12 2:49 PM 5.62 miles 58 mph 10/19/12 3:30 PM 0.95 miles 32 mph 1
h 2.93 miles 41 mph 10/19/12 8:35 PM 7.12 miles 56 mph 10/20/12 6:57 AM 15.4 miles 48 mph 10/03/12 6:01:24 AM 8.17 miles 43 mph 10/03/12 2:39:38 PM 0.86 miles 33 mph 1
22 miles 38 mph 10/3/12 9:56 PM 0.02 miles 8 mph 10/03/12 10:28 PM 0.80 miles 35 mph 10/03/12 10:41 PM 0.81 miles 34 mph 10/04/12 10:45 AM 3.06 miles 39 mph 10/04/12 1
es 35 mph 10/04/12 4:11 PM 7.25 miles 51 mph 10/04/12 4:25 PM 11.99 miles 52 mph 10/04/12 7:09 PM 0.37 miles 27 mph 10/04/12 7:14 PM 16.41 miles 67 mph 10/04/12 8:53 P
2 mph 10/05/12 9:50 PM 0.02 miles 8 mph 10/05/12 10:25 PM 4.46 miles 6 mph 10/05/12 10:42 PM 1.85 miles 33 mph 10/06/12 7:29 AM 0.92 miles 42 mph 10/06/12 2:39 PM 0.8
s 45 mph 10/06/12 8:54 PM 7.98 miles 45 mph 10/07/12 6:04 AM 0.50 miles 34 mph 10/07/12 7:42 AM 0.72 miles 29 mph mph 10/07/12 7:50 AM 0.84 miles 31 mph 10/07/12 2:36 P
1 mph 10/09/12 2:36 PM 8.14 miles 44 mph 10/09/12 3:27 PM 2.48 miles 36 mph 10/09/12 3:43 PM 1.12 miles 41 mph 10/09/12 3:48 PM 3.48 miles 48 mph 10/09/12 3:58 PM 0.
2 7:24 PM 0.68 miles 33 mph 10/09/12 7:28 PM 0.02 miles 9 mph 10/09/12 7:40 PM 2.47 miles 58 mph 10/09/12 8:11 PM 2.42 miles 50 mph 10/10/12 6:34 AM 7.97 42 mph 10/10/
7 miles 36 mph 10/10/12 4:27 PM 0 miles 2 mph 10/10/12 7:01 PM 0.63 miles 31 mph 10/10/12 7:10 PM 7.71 miles 55 mph 10/10/12 7:52 PM 4.13 miles 42 mph 10/10/12 9:47 PM 4 m
ph 10/11/12 6:35 PM 0.27 miles 29 mph 10/11/12 6:45 PM 0.29 miles 37 mph 10/11/12 7:01 PM 3.97 miles 57 mph 10/11/12 7:26 PM 2.95 miles 55 mph 10/11/12 7:46 PM 5.87 m
M 2.19 miles 45 mph 10/12/12 11:27 AM 2.13 miles 42 mph 10/12/12 12:40 PM 2.43 miles 60 mph 10/12/12 12:56 PM 2.43 miles 60 mph 10/12/12 4:44 PM 7.1 miles 66 mph 10/
2 35 mph 10/13/12 2:31 PM 1.18 miles 36 mph 10/13/12 4:05 PM 9.64 miles 57 mph 10/13/12 5:31 PM 0.95 miles 34 mph 10/13/12 5:36 PM 4.98 miles 40 mph 10/13/12 6:49 P
8 mph 10/17/12 7:15 PM 1.27 miles 36 mph 10/17/12 7:26 PM 5.43 miles 42 mph 10/17/12 8:03 PM 8.36 miles 63 mph 10/17/12 9:37 PM 1.48 miles 34 mph 10/17/12 9:54 PM 4.3 m
h 10/18/12 1:16 PM 3.55 miles 47 mph 10/18/12 1:28 PM 0 miles 0 mph 10/18/12 1:45 PM 3.89 miles 42 mph 10/18/12 3:21 PM 0.94 miles 35 mph 10/18/12 4:35 PM 0 miles 0 m
M 1.2 miles 36 mph 10/18/12 11:14 PM 1.14 miles 35 mph 10/18/12 11:27 PM 2.29 miles 35 mph 10/18/12 11:35 PM 0.94 miles 33 mph 10/19/12 12:53 AM 1.52 miles 39 mph 1
2 4:30 PM 2.53 miles 45 mph 10/19/12 6:50 PM 2.32 miles 42 mph 10/19/12 8:19 PM 2.93 miles 41 mph 10/19/12 8:35 PM 7.12 miles 56 mph 10/20/12 6:57 AM 15.4 miles 48 m
iles 47 mph 10/3/12 6:05 PM 7.15 miles 44 mph 10/3/12 6:22 PM 0.01 miles 5 mph 10/03/12 7:34 PM 1.71 miles 38 mph 10/03/12 8:01 PM 0.33 miles 32 mph 10/03/12 8:06 PM 1
3 mph 10/4/12 12:39 PM 0 miles 0 mph 10/04/12 12:49 PM 0.01 miles 3 mph 10/04/12 1:41 PM 0.93 miles 32 mph 10/04/12 2:07 PM 0.01 miles 3 mph 10/04/12 3:56 PM 0.94 m
4 PM 9.72 miles 52 mph 10/04/12 10:32 PM 10.86 miles 50 mph 10/04/12 11:11 PM 1.87 miles 35 mph 10/05/12 1:31 PM 00.95 miles 33 mph 10/05/12 2:34 PM 0.01 miles 6 mph 1
2 3:02 PM 7.11 miles 45 mph 10/06/12 3:21 PM 1.41 miles 39 mph 10/06/12 3:25 PM 0.36 miles 39 mph 10/06/12 3:28 PM 6.42 miles 45 mph 10/06/12 4:53 PM 6.67 miles 42 mp
2 6:03 AM 8.19 miles 48 mph 10/08/12 7:40 AM 0.43 miles 32 mph 10/08/12 2:36 PM 7.98 miles 44 mph 10/09/12 6:02 AM 7.97 miles 47 mph 10/09/12 7:37 AM 0.74 miles 36 mph 1
M 3.21 miles 47 mph 10/09/12 5:13 PM 0.01 miles 3 mph 10/09/12 5:46 PM 0.65 miles 35 mph 10/09/12 7:03 PM 1.02 miles 29 mph 10/09/12 7:22 PM 0.02 miles 6 mph 10/09/1
h 10/10/12 7:45 AM 0.79 miles 33 mph 10/10/12 2:25 PM 0.87 miles 38 mph 10/10/12 2:36 PM 2.10 miles 42 mph 10/10/12 2:45 PM 4.98 miles 48 mph 10/10/12 4:08 PM 0.67 miles 3
0:31 PM 0.01 miles 8 mph 10/10/12 11:18 PM 2.19 miles 48 mph 10/11/12 12:50 PM 7.71 miles 62 mph 10/11/12 3:24 PM 2.34 miles 47 mph 10/11/12 3:40 PM 2.32 miles 47 mp
57 miles 47 mph 10/11/12 10:00 PM 6 miles 45 mph 10/11/12 10:20 PM 0.01 miles 7 mph 10/11/12 10:50 PM 4.9 miles 58 mph 10/12/12 10:12 AM 1.27 miles 32 mph 10/12/12 1
7 mph 10/12/12 5:52 PM 0.04 miles 12 mph 10/12/12 6:00 PM 0.01 miles 5 mph 10/12/12 6:09 PM 0.45 miles 34 mph 10/12/12 6:19 PM 16.09 miles 66 mph 10/13/12 1:40 PM 1.1
h 10/13/12 7:07 PM 1.8 miles 32 mph 10/13/12 7:19 PM 1.39 miles 36 mph 10/14/12 6:07 AM 7.95 miles 45 mph 10/17/12 5:13 PM 7.3 miles 45 mph 10/17/12 6:25 PM 10.19 mil
M 3.99 miles 42 mph 10/18/12 12:23 AM 0.02 miles 7 mph 10/18/12 11:47 AM 0.95 miles 32 mph 10/18/12 11:53 AM 0.01 miles 6 mph 10/18/12 12:10 PM 0 miles 0 mph 10/18/
h 10/18/12 5:09 PM 5.62 miles 42 mph 10/18/12 6:50 PM 7.13 miles 45 mph 10/18/12 10:13 PM 2.94 miles 62 mph 10/18/12 10:33 PM 3.56 miles 53 mph 10/18/12 10:57 PM 0.16 2
/19/12 2:53 AM 1.48 miles 35 mph 10/19/12 2:15 PM 0.94 miles 32 mph 10/19/12 2:49 PM 5.62 miles 58 mph 10/19/12 3:30 PM 0.95 miles 32 mph 10/19/12 4:04 PM 1.29 miles 3
2 8:35 PM 7.12 miles 56 mph 10/20/12 6:57 AM 15.4 miles 48 mph 10/03/12 6:01:24 AM 8.17 miles 43 mph 10/03/12 2:39:38 PM 0.86 miles 33 mph 10/03/12 3:15 PM 12.21 miles 5
:56 PM 0.02 miles 8 mph 10/03/12 10:28 PM 0.80 miles 35 mph 10/03/12 10:41 PM 0.81 miles 34 mph 10/04/12 10:45 AM 3.06 miles 39 mph 10/04/12 11:24 AM 7.13 miles 42 m
M 7.25 miles 51 mph 10/04/12 4:25 PM 11.99 miles 52 mph 10/04/12 7:09 PM 0.37 miles 27 mph 10/04/12 7:14 PM 16.41 miles 67 mph 10/04/12 8:53 PM 1.65 miles 45 mph 10/04
/12 9:50 PM 0.02 miles 8 mph 10/05/12 10:25 PM 4.46 miles 6 mph 10/05/12 10:42 PM 1.85 miles 33 mph 10/06/12 7:29 AM 0.92 miles 42 mph 10/06/12 2:39 PM 0.84 miles 39 m
2 8:54 PM 7.98 miles 45 mph 10/07/12 6:04 AM 0.50 miles 34 mph 10/07/12 7:42 AM 0.72 miles 29 mph mph 10/07/12 7:50 AM 0.84 miles 31 mph 10/07/12 2:36 PM 7.98 miles 52 m
h 10/09/12 2:36 PM 8.14 miles 44 mph 10/09/12 3:27 PM 2.48 miles 36 mph 10/09/12 3:43 PM 1.12 miles 41 mph 10/09/12 3:48 PM 3.48 miles 48 mph 10/09/12 3:58 PM 0.67 mi
2 7:24 PM 0.68 miles 33 mph 10/09/12 7:28 PM 0.02 miles 9 mph 10/09/12 7:40 PM 2.47 miles 58 mph 10/09/12 8:11 PM 2.42 miles 50 mph 10/10/12 6:34 AM 7.97 42 mph 10/10/
7 miles 36 mph 10/10/12 4:27 PM 0 miles 2 mph 10/10/12 7:01 PM 0.63 miles 31 mph 10/10/12 7:10 PM 7.71 miles 55 mph 10/10/12 7:52 PM 4.13 miles 42 mph 10/10/12 9:47 PM 4 m
ph 10/11/12 6:35 PM 0.27 miles 29 mph 10/11/12 6:45 PM 0.29 miles 37 mph 10/11/12 7:01 PM 3.97 miles 57 mph 10/11/12 7:26 PM 2.95 miles 55 mph 10/11/12 7:46 PM 5.87 m
M 2.19 miles 45 mph 10/12/12 11:27 AM 2.13 miles 42 mph 10/12/12 12:40 PM 2.43 miles 60 mph 10/12/12 12:56 PM 2.43 miles 60 mph 10/12/12 4:44 PM 7.1 miles 66 mph 10/
2 35 mph 10/13/12 2:31 PM 1.18 miles 36 mph 10/13/12 4:05 PM 9.64 miles 57 mph 10/13/12 5:31 PM 0.95 miles 34 mph 10/13/12 5:36 PM 4.98 miles 40 mph 10/13/12 6:49 P
8 mph 10/17/12 7:15 PM 1.27 miles 36 mph 10/17/12 7:26 PM 5.43 miles 42 mph 10/17/12 8:03 PM 8.36 miles 63 mph 10/17/12 9:37 PM 1.48 miles 34 mph 10/17/12 9:54 PM 4.3 m
h 10/18/12 1:16 PM 3.55 miles 47 mph 10/18/12 1:28 PM 0 miles 0 mph 10/18/12 1:45 PM 0.94 AM 10/03/12 6:01:24 AM 8.17 miles 43 mph 10/03/12 2:39:38 PM 0.86 miles 33 m
M 1.22 miles 38 mph 10/3/12 9:56 PM 0.02 miles 8 mph 10/03/12 10:28 PM 0.80 miles 35 mph 10/03/12 10:41 PM 0.81 miles 34 mph 10/04/12 10:45 AM 3.06 miles 39 mph 10/0
4 miles 35 mph 10/04/12 4:11 PM 7.25 miles 51 mph 10/04/12 4:25 PM 11.99 miles 52 mph 10/04/12 7:09 PM 0.37 miles 27 mph 10/04/12 7:14 PM 16.41 miles 67 mph 10/04/12 8
M 0.92 miles 32 mph 10/05/12 9:50 PM 0.02 miles 8 mph 10/05/12 10:25 PM 4.46 miles 6 mph 10/05/12 10:42 PM 1.85 miles 33 mph 10/06/12 7:29 AM 0.92 miles 42 mph 10/06/1
2 6:43 PM 7.96 miles 45 mph 10/06/12 8:54 PM 7.98 miles 45 mph 10/07/12 6:04 AM 0.50 miles 34 mph 10/07/12 7:42 AM 0.72 miles 29 mph mph 10/07/12 7:50 AM 0.84 miles 31 m
h 10/09/12 7:46 AM 0.78 miles 31 mph 10/09/12 2:36 PM 8.14 miles 44 mph 10/09/12 3:27 PM 2.48 miles 36 mph 10/09/12 3:43 PM 1.12 miles 41 mph 10/09/12 3:48 PM 3.48 mi
M 0.02 miles 6 mph 10/09/12 7:24 PM 0.68 miles 33 mph 10/09/12 7:28 PM 0.02 miles 9 mph 10/09/12 7:40 PM 2.47 miles 58 mph 10/09/12 8:11 PM 2.42 miles 50 mph 10/10/12 6
8 mph 10/10/12 4:08 PM 0.67 miles 36 mph 10/10/12 4:27 PM 0 miles 2 mph 10/10/12 7:01 PM 0.63 miles 31 mph 10/10/12 7:10 PM 7.71 miles 55 mph 10/10/12 7:52 PM 4.13 mil
0 PM 2.32 miles 47 mph 10/11/12 6:35 PM 0.27 miles 29 mph 10/11/12 6:45 PM 0.29 miles 37 mph 10/11/12 7:01 PM 3.97 miles 57 mph 10/11/12 7:26 PM 2.95 miles 55 mph 10/1
M 2.19 miles 45 mph 10/12/12 11:27 AM 2.13 miles 42 mph 10/12/12 12:40 PM 2.43 miles 60 mph 10/12/12 12:56 PM 2.43 miles 60 mph 10/12/12 4:44 PM 7.1 miles 66 mph 10/
h 10/13/12 1:40 PM 1.12 35 mph 10/13/12 2:31 PM 1.18 miles 36 mph 10/13/12 4:05 PM 9.64 miles 57 mph 10/13/12 5:31 PM 0.95 miles 34 mph 10/13/12 5:36 PM 4.98 miles 4
:25 PM 10.19 miles 58 mph 10/17/12 7:15 PM 1.27 miles 36 mph 10/17/12 7:26 PM 5.43 miles 42 mph 10/17/12 8:03 PM 8.36 miles 63 mph 10/17/12 9:37 PM 1.48 miles 34 mph 1
0 PM 0 miles 0 mph 10/18/12 1:16 PM 3.55 miles 47 mph 10/18/12 1:28 PM 0 miles 0 mph 10/18/12 1:45 PM 3.89 miles 42 mph 10/18/12 3:21 PM 0.94 miles 35 mph 10/18/12 4
ph 10/18/12 11:03 PM 1.2 miles 36 mph 10/18/12 11:14 PM 1.14 miles 35 mph 10/18/12 11:27 PM 2.29 miles 35 mph 10/18/12 11:35 PM 0.94 miles 33 mph 10/19/12 12:53 AM 1
s 36 mph 10/19/12 4:30 PM 2.53 miles 45 mph 10/19/12 6:50 PM 2.32 miles 42 mph 10/19/12 8:19 PM 2.93 miles 41 mph 10/19/12 8:35 PM 7.12 miles 56 mph 10/20/12 6:57 AM 1
s 5 mph 10/03/12 7:34 PM 1.71 miles 38 mph 10/03/12 8:01 PM 0.33 miles 32 mph 10/03/12 8:06 PM 1.22 miles 38 mph 10/3/12 9:56 PM 0.02 miles 8 mph 10/03/12 10:28 PM 0.8
h 10/04/12 1:41 PM 0.93 miles 32 mph 10/04/12 2:07 PM 0.01 miles 3 mph 10/04/12 3:56 PM 0.94 miles 35 mph 10/04/12 4:11 PM 7.25 miles 51 mph 10/04/12 4:25 PM 11.99 mil
M 00.95 miles 33 mph 10/05/12 2:34 PM 0.01 miles 6 mph 10/05/12 5:57 PM 0.92 miles 32 mph 10/05/12 9:50 PM 0.02 miles 8 mph 10/05/12 10:25 PM 4.46 miles 51 mph 10/04/1
h 10/06/12 3:25 PM 0.36 miles 39 mph 10/06/12 3:28 PM 6.42 miles 45 mph 10/06/12 4:53 PM 6.67 miles 42 mph 10/06/12 6:43 PM 7.96 miles 45 mph 10/06/12 8:54 PM 7.98 m
/12 2:36 PM 7.98 miles 44 mph 10/09/12 6:02 AM 7.97 miles 47 mph 10/09/12 7:37 AM 0.74 miles 36 mph 10/09/12 7:46 AM 0.78 miles 31 mph 10/09/12 2:36 PM 8.14 miles 44 m
M 0.01 miles 3 mph 10/09/12 5:46 PM 0.65 miles 35 mph 10/09/12 7:03 PM 1.02 miles 29 mph 10/09/12 7:22 PM 0.02 miles 6 mph 10/09/12 7:24 PM 0.68 miles 33 mph 10/09/1
3 mph 10/10/12 2:25 PM 0.87 miles 38 mph 10/10/12 2:36 PM 2.10 miles 42 mph 10/10/12 2:45 PM 4.98 miles 48 mph 10/10/12 4:08 PM 0.67 miles 36 mph 10/10/12 4:27 PM 0 m
8 PM 2.19 miles 48 mph 10/11/12 12:50 PM 7.71 miles 62 mph 10/11/12 3:24 PM 2.34 miles 47 mph 10/11/12 3:40 PM 2.32 miles 47 mph 10/11/12 6:35 PM 0.27 miles 29 mph 10
h 10/11/12 10:20 PM 0.01 miles 7 mph 10/11/12 10:50 PM 4.9 miles 58 mph 10/12/12 10:12 AM 1.27 miles 32 mph 10/12/12 10:40 AM 2.19 miles 45 mph 10/12/12 11:27 AM 2.13 m
2 5:52 PM 0.04 miles 12 mph 10/12/12 6:00 PM 0.01 miles 5 mph 10/12/12 6:09 PM 0.45 miles 34 mph 10/12/12 6:19 PM 16.09 miles 66 mph 10/13/12 1:40 PM 1.12 35 mph 10/
h 10/13/12 7:07 PM 1.8 miles 32 mph 10/13/12 7:19 PM 1.39 miles 36 mph 10/14/12 6:07 AM 7.95 miles 45 mph 10/17/12 5:13 PM 7.3 miles 45 mph 10/17/12 6:25 PM 10.19 mil
2 10:36 PM 2.07 miles 39 mph 10/17/12 11:58 PM 3.99 miles 42 mph 10/18/12 12:23 AM 0.02 miles 7 mph 10/18/12 11:47 AM 0.95 miles 32 mph 10/18/12 11:53 AM 0.01 miles 6 m
2 miles 42 mph 10/18/12 5:09 PM 5.62 miles 42 mph 10/18/12 6:50 PM 7.13 miles 45 mph 10/18/12 10:13 PM 2.94 miles 62 mph 10/18/12 10:33 PM 3.56 miles 53 mph 10/18/12 1
s 39 mph 10/19/12 2:53 AM 1.48 miles 35 mph 10/19/12 2:15 PM 0.94 miles 32 mph 10/19/12 2:49 PM 5.62 miles 58 mph 10/19/12 3:30 PM 0.95 miles 32 mph 10/19/12 4:04 PM 1
es 41 mph 10/19/12 8:35 PM 7.12 miles 56 mph 10/20/12 6:57 AM 15.4 miles 48 mph 10/03/12 6:01:24 AM 8.17 miles 43 mph 10/03/12 2:39:38 PM 0.86 miles 33 mph 10/03/12 3
ph 10/3/12 9:56 PM 0.02 miles 8 mph 10/03/12 10:28 PM 0.80 miles 35 mph 10/03/12 10:41 PM 0.81 miles 34 mph 10/04/12 10:45 AM 3.06 miles 39 mph 10/04/12 11:24 AM 7.1
04/12 4:11 PM 7.25 miles 51 mph 10/04/12 4:25 PM 11.99 miles 52 mph 10/04/12 7:09 PM 0.37 miles 27 mph 10/04/12 7:14 PM 16.41 miles 67 mph 10/04/12 8:53 PM 1.65 miles 4
5/12 9:50 PM 0.02 miles 8 mph 10/05/12 10:25 PM 4.46 miles 6 mph 10/05/12 10:42 PM 1.85 miles 33 mph 10/06/12 7:29 AM 0.92 miles 42 mph 10/06/12 2:39 PM 0.84 miles 3
s 45 mph 10/06/12 8:54 PM 7.98 miles 45 mph 10/07/12 6:04 AM 0.50 miles 34 mph 10/07/12 7:42 AM 0.72 miles 29 mph mph 10/07/12 7:50 AM 0.84 miles 31 mph 10/07/12 2:36 P
h 10/09/12 7:46 AM 0.78 miles 31 mph 10/09/12 2:36 PM 8.14 miles 44 mph 10/09/12 3:27 PM 2.48 miles 36 mph 10/09/12 3:43 PM 1.12 miles 41 mph 10/09/12 3:48 PM 3.48 mi
M 0.02 miles 6 mph 10/09/12 7:24 PM 0.68 miles 33 mph 10/09/12 7:28 PM 0.02 miles 9 mph 10/09/12 7:40 PM 2.47 miles 58 mph 10/09/12 8:11 PM 2.42 miles 50 mph 10/10/12 6
8 mph 10/10/12 4:08 PM 0.67 miles 36 mph 10/10/12 4:27 PM 0 miles 2 mph 10/10/12 7:01 PM 0.63 miles 31 mph 10/10/12 7:10 PM 7.71 miles 55 mph 10/10/12 7:52 PM 4.13 mil
/12 3:40 PM 2.32 miles 47 mph 10/11/12 6:35 PM 0.27 miles 29 mph 10/11/12 6:45 PM 0.29 miles 37 mph 10/11/12 7:01 PM 3.97 miles 57 mph 10/11/12 7:26 PM 2.95 miles 55 m
2 10:40 AM 2.19 miles 45 mph 10/12/12 11:27 AM 2.13 miles 42 mph 10/12/12 12:40 PM 2.43 miles 60 mph 10/12/12 12:56 PM 2.43 miles 60 mph 10/12/12 4:44 PM 7.1 miles 66 m
6 mph 10/13/12 1:40 PM 1.12 35 mph 10/13/12 2:31 PM 1.18 miles 36 mph 10/13/12 4:05 PM 9.64 miles 57 mph 10/13/12 5:31 PM 0.95 miles 34 mph 10/13/12 5:36 PM 4.98 mi
0/17/12 6:25 PM 10.19 miles 58 mph 10/17/12 7:15 PM 1.27 miles 36 mph 10/17/12 7:26 PM 5.43 miles 42 mph 10/17/12 8:03 PM 8.36 miles 63 mph 10/17/12 9:37 PM 1.48 mile
3 AM 0.01 miles 6 mph 10/18/12 12:10 PM 0 miles 0 mph 10/18/12 1:16 PM 3.55 miles 47 mph 10/18/12 1:28 PM 0 miles 0 mph 10/18/12 1:45 PM 3.89 miles 42 mph 10/18/12 3
s 53 mph 10/18/12 10:57 PM 0.16 22 mph 10/18/12 11:03 PM 1.2 miles 36 mph 10/18/12 11:14 PM 1.14 miles 35 mph 10/18/12 11:27 PM 2.29 miles 35 mph 10/18/12 11:35 PM 0.
ph 10/19/12 4:04 PM 1.29 miles 36 mph 10/19/12 4:30 PM 2.53 miles 45 mph 10/19/12 6:50 PM 2.32 miles 42 mph 10/19/12 8:19 PM 2.93 miles 41 mph 10/19/12 8:35 PM 7.12 m
M 12.21 miles 52 mph 10/3/12 4:03 PM 6.91 miles 47 mph 10/3/12 6:05 PM 7.15 miles 44 mph 10/3/12 6:22 PM 0.01 miles 5 mph 10/03/12 7:34 PM 1.71 miles 38 mph 10/03/12 8
The Progressive Corporation
2012 Annual Report to Shareholders
Table of contents
-
Page 1
... 10/19/12 6:50 PM 2.32 miles 42 mph 10/19/12 8:19 PM 2.93 miles 41 mph 10/19/12 8:35 PM 7.12 The Progressive Corporation 2012 Annual Report to Shareholders -
Page 2
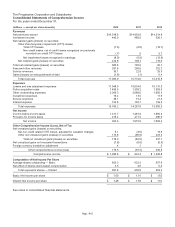
The Progressive Corporation and Subsidiaries Consolidated Statements of Comprehensive Income For the years ended December 31, (millions - except per share amounts) 2012 2011 2010 Revenues Net premiums earned Investment income Net realized gains (losses) on securities: Other-than-temporary ... -
Page 3
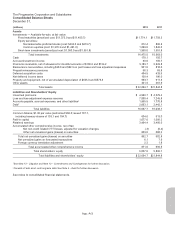
... 31, (millions) 2012 2011 Assets Investments - Available-for-sale, at fair value: Fixed maturities (amortized cost: $11,373.9 and $11,455.7) Equity securities: Nonredeemable preferred stocks (cost: $404.0 and $473.7) Common equities (cost: $1,370.3 and $1,431.0) Short-term investments (amortized... -
Page 4
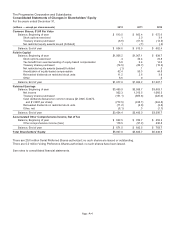
...share amounts) 2012 2011 2010 Common Shares, $1.00 Par Value Balance, Beginning of year Stock options exercised Treasury shares purchased Net restricted equity awards issued (forfeited) Balance, End of year Paid-In Capital Balance, Beginning of year Stock options exercised Tax benefit from exercise... -
Page 5
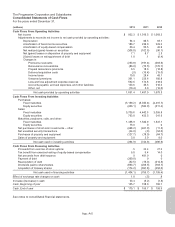
... acquisition costs Income taxes Unearned premiums Loss and loss adjustment expense reserves Accounts payable, accrued expenses, and other liabilities Other, net Net cash provided by operating activities Cash Flows From Investing Activities Purchases: Fixed maturities Equity securities Sales: Fixed... -
Page 6
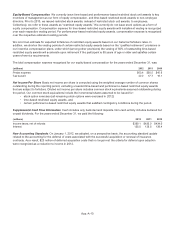
... Companies) provide personal and commercial automobile insurance and other specialty property-casualty insurance and related services. Our Personal Lines segment writes insurance for personal autos and recreational vehicles through both an independent insurance agency channel and a direct channel... -
Page 7
... changes in market conditions could materially affect the portfolio's value in the near term. We regularly monitor our portfolio for price changes, which might indicate potential impairments, and perform detailed reviews of securities with unrealized losses. In such cases, changes in fair value... -
Page 8
... unexpired risk. We provide insurance and related services to individuals and small commercial accounts and offer a variety of payment plans. Generally, premiums are collected prior to providing risk coverage, minimizing our exposure to credit risk. We perform a policy level evaluation to determine... -
Page 9
... Property and equipment are recorded at cost, less accumulated depreciation, and include capitalized software developed or acquired for internal use. Depreciation is recognized over the estimated useful lives of the assets using accelerated methods for most computer equipment and the straight-line... -
Page 10
...and time-based restricted stock awards to non-employee directors. Prior to 2010, we issued restricted stock awards, instead of restricted stock unit awards, to employees. Collectively, we refer to these awards as "restricted equity awards." We currently do not issue stock options as a form of equity... -
Page 11
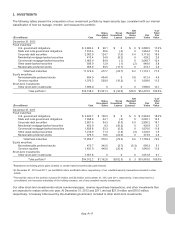
...) Cost Fair Value December 31, 2012 Fixed maturities: U.S. government obligations State and local government obligations Corporate debt securities Residential mortgage-backed securities Commercial mortgage-backed securities Other asset-backed securities Redeemable preferred stocks Total fixed... -
Page 12
...31, 2012 or 2011. At December 31, 2012, we did not have any debt securities that were non-income producing during the preceding 12 months. Fixed Maturities The composition of fixed maturities by maturity at December 31, 2012, was: (millions) Cost Fair Value Less than one year One to five years Five... -
Page 13
... 12 Months or Greater Fair Unrealized Value Losses (millions) December 31, 2012 Fixed maturities: State and local government obligations Corporate debt securities Residential mortgage-backed securities Commercial mortgage-backed securities Other asset-backed securities Redeemable preferred stocks... -
Page 14
... (i.e., expected recovery value) was calculated using the current book yield for each security, and was compared to its current amortized value. In the event that the net present value was below the amortized value, a credit loss was deemed to exist, and the security was written down. App.-A-14 -
Page 15
... the years ended December 31, were: (millions) 2012 2011 2010 Gross realized gains on security sales Fixed maturities: U.S. government obligations State and local government obligations Corporate and other debt securities Residential mortgage-backed securities Commercial mortgage-backed securities... -
Page 16
...: (millions) 2012 2011 2010 Fixed maturities: U.S. government obligations State and local government obligations Corporate debt securities Residential mortgage-backed securities Commercial mortgage-backed securities Other asset-backed securities Redeemable preferred stocks Total fixed maturities... -
Page 17
...) Fair Value December 31, 2010 Purpose Classification 2012 2011 Comprehensive Income Statement Net Realized Gains (Losses) on Securities Years ended December 31, 2012 2011 2010 Notional Value1 December 31, Derivatives designated as: 2012 2011 Hedging instruments Closed: Manage interest $223 rate... -
Page 18
..., into a fair value hierarchy of three levels, as follows: • • Level 1: Inputs are unadjusted, quoted prices in active markets for identical instruments at the measurement date (e.g., U.S. government obligations, active exchange-traded equity securities, and certain short-term securities). Level... -
Page 19
...by major security type was: Fair Value Level 2 Level 3 (millions) Level 1 Total Cost December 31, 2012 Fixed maturities: U.S. government obligations State and local government obligations Corporate debt securities Subtotal Asset-backed securities: Residential mortgage-backed Commercial mortgage... -
Page 20
... of discount or premium, since that value very closely approximates what an active market participant would be willing to pay for such securities. The remainder of our short-term securities are classified as Level 2 and are not priced externally since these securities continually trade at par value... -
Page 21
...our Level 2 classifications (excluding short-term investments), while dealer-quoted prices represented 2%, compared to 96% and 4%, respectively, at December 31, 2011. In our process for selecting a source (e.g., dealer, pricing service) to provide pricing for securities in our portfolio, we reviewed... -
Page 22
...and 2011: Level 3 Fair Value Fair Value Calls/ Net Realized Net Fair Value at Dec. 31, Maturities/ (Gain)/Loss Change in Transfers at Dec. 31, 2011 Paydowns Purchases Sales on Sales Valuation In (Out) 2012 (millions) Fixed maturities: Asset-backed securities: Residential mortgage-backed Commercial... -
Page 23
... Measurements Fair Value Unobservable at Dec. 31, Unobservable Input 2012 Valuation Technique Input Assumption ($ in millions) Fixed maturities: Asset-backed securities: Residential mortgage-backed Commercial mortgage-backed Total fixed maturities Equity securities: Nonredeemable preferred stocks... -
Page 24
... net proceeds from the sale of certain qualifying capital securities. We must use our commercially reasonable efforts, subject to certain market disruption events, to sell enough qualifying capital securities to permit repayment of the 6.70% Debentures in full on the scheduled maturity date or, if... -
Page 25
...millions) Year Payments 2013 2014 2015 2016 2017 Thereafter Total $ 150.0 0 0 0 0 1,931.2 $2,081.2 Our next scheduled debt maturity is $150 million of our 7% Notes due October 2013. 5. INCOME TAXES The components of our income tax provision were as follows: (millions) 2012 2011 2010 Current tax... -
Page 26
... in dispute for the 2010 tax year. The first issue relates to partial worthlessness deductions on certain debt instruments. An Industry Director Directive (IDD) was issued in 2012 addressing this issue for open tax years. The deductions we claimed on our tax returns generally follow the guidance... -
Page 27
... Florida personal injury protection coverage and an increase in our estimate of bodily injury severity for accident year 2011. Unfavorable development in our Commercial Auto business reflects higher than anticipated frequency and severity costs on late emerging claims and higher settlements on large... -
Page 28
... and (ii) state-mandated involuntary Commercial Auto Insurance Procedures/Plans ("CAIP"). Collectively, the State Plans accounted for 98%, 94%, and 82% of our ceded premiums for the years ended December 31, 2012, 2011, and 2010, respectively; the MCCA and NCRF together accounted for 80%, 80%, and 70... -
Page 29
... by the company for the 401(k) Plan were $66.5 million, $64.1 million, and $61.3 million for the years ended December 31, 2012, 2011, and 2010, respectively. Postemployment Benefits Progressive provides various postemployment benefits to former or inactive employees who meet eligibility requirements... -
Page 30
... December 31, follows: 2012 Weighted Average Grant Date Fair Value 2011 Weighted Average Grant Date Fair Value 2010 Weighted Average Grant Date Fair Value Restricted Equity Awards Number of Shares1 Number of Shares1 Number of Shares1 Beginning of year Add (deduct): Granted2 Vested Forfeited... -
Page 31
... employee stock option activity during the years ended December 31, 2011 and 2010. All non-qualified stock options vested on or before January 1, 2007 and expired on December 31, 2011. All options granted had an exercise price equal to the market value of the common shares on the date of grant. 2011... -
Page 32
...December 31, follows: 2012 Weighted Average Grant Number of Date Fair Shares Value 2011 Weighted Average Grant Number of Date Fair Shares Value 2010 Weighted Average Grant Number of Date Fair Shares Value Restricted Stock Beginning of year Add (deduct): Granted Vested End of year Available, end of... -
Page 33
... 2011, respectively, to be distributed in common shares. 10. SEGMENT INFORMATION We write personal auto and other specialty property-casualty insurance and provide related services throughout the United States. Our Personal Lines segment writes insurance for personal autos and recreational vehicles... -
Page 34
...% of the total Personal Lines segment net premiums earned in both 2012 and 2011, and 90% in 2010; insurance for our special lines products (e.g., motorcycles, ATVs, RVs, mobile homes, watercraft, and snowmobiles) accounted for the balance of the Personal Lines net premiums earned. profit (loss) for... -
Page 35
... named as defendants in a number of class action or individual lawsuits arising out of the operations of the insurance subsidiaries. Other insurance companies face many of these same issues. The lawsuits discussed below are in various stages of development. We plan to contest these suits vigorously... -
Page 36
...putative class action lawsuits challenging the labor rates our insurance subsidiaries pay to auto body repair shops. One patent matter alleging Progressive infringes on patented marketing technology. One putative class action alleging Progressive steers customers to service centers and network shops... -
Page 37
... the labor rates our insurance subsidiaries pay to auto body repair shops; the case was settled and paid on an individual basis in 2011. One class action lawsuit certified for settlement that alleged Progressive charged insureds for illusory uninsured motorist/underinsured motorist coverage on... -
Page 38
...present fairly, in all material respects, the financial position of The Progressive Corporation and its subsidiaries at December 31, 2012 and 2011, and the results of their operations and their cash flows for each of the three years in the period ended December 31, 2012 in conformity with accounting... -
Page 39
... Progressive's management is responsible for establishing and maintaining adequate internal control over financial reporting, as such term is defined in Rule 13a-15(f) under the Securities Exchange Act of 1934. Our internal control structure was designed under the supervision of our Chief Executive... -
Page 40
... 2012. Our insurance companies offer personal and commercial automobile insurance and other specialty property-casualty insurance and related services throughout the United States, as well as personal auto insurance on an Internet-only basis in Australia. Our Personal Lines segment writes insurance... -
Page 41
... year, the annual premium of customers choosing Snapshot crossed $1 billion Name Your Price® - a tool that allows consumers to name or select the price they would like to pay for auto insurance and match it to a range of available coverage combinations New product models in both our Personal Lines... -
Page 42
... Commercial Auto business and our special lines products remained relatively unchanged from the prior year. We realize the importance that retention has on our ability to continue to grow profitably and will maintain our focus on providing customers with other insurance-related products and services... -
Page 43
...) 2012 2011 2010 Total number of shares purchased Total cost Average price paid per share 8.6 $174.2 $20.26 51.3 $997.8 $19.45 13.3 $258.6 $19.40 Progressive maintains a policy of paying an annual variable dividend that, if declared, would be payable shortly after the close of the year. This... -
Page 44
... our annual variable dividend program in those years. B. Liquidity and Capital Resources Progressive's insurance operations create liquidity by collecting and investing premiums from new and renewal business in advance of paying claims. As an auto insurer, our claims liabilities are generally short... -
Page 45
... discussed above. Short-Term Borrowings During the last three years, we did not engage in short-term borrowings to fund our operations. As discussed above, our insurance operations create liquidity by collecting and investing insurance premiums in advance of paying claims. Information concerning our... -
Page 46
...-20 new service centers, each co-located with a full service claims office. The cost of these facilities, excluding land, is estimated to average $4 to $6 million per center, depending on a number of variables, including the size and location of the center. We maintain insurance on our real property... -
Page 47
...As of December 31, our policies in force were: (thousands) 2012 2011 2010 POLICIES IN FORCE Personal Lines Agency auto Direct auto Total auto Special lines1 Total Personal Lines Growth over prior year POLICIES IN FORCE Commercial Auto Growth over prior year 1 Includes 4,790.4 4,000.1 8,790.5 3,944... -
Page 48
... review new policies, rate levels, and the retention characteristics of our books of business. The following table shows our year-over-year changes in new and renewal applications (i.e., issued policies): Growth Over Prior Year 2012 2011 2010 APPLICATIONS Personal Lines New Renewal Commercial Auto... -
Page 49
... companies. We experienced the following changes in written premium per policy: Change Over Prior Year 2012 2011 2010 WRITTEN PREMIUM PER POLICY Personal Lines - auto Commercial Auto 3% 10% (1)% 5% (1)% (6)% We increased rates in our personal auto business in 2012 in response to rising claims... -
Page 50
... the low level of premiums earned by, and the variability of loss costs in, such businesses. Our underwriting margin for 2012 was consistent with our long-term profitability target of 4% and exceeded this target in both 2011 and 2010. Pricing and market conditions are always significant drivers of... -
Page 51
... about 1.5% in 2010, over the prior-year periods 2012 - Severity increases in most of our auto coverages were about 5%, including bodily injury, personal injury protection (PIP), property damage, and collision. 2011 - Severity in our bodily injury and property coverages increased about 1%-2%, while... -
Page 52
... claims service to our customers. The table below presents the actuarial adjustments implemented and the loss reserve development experienced in the years ended December 31: ($ in millions) 2012 2011 2010 Actuarial Adjustments Reserve decrease/(increase) Prior accident years Current accident year... -
Page 53
... in our Florida PIP coverage and an increase in our estimate of bodily injury severity for accident year 2011. Unfavorable development in our Commercial Auto business reflects higher than anticipated frequency and severity costs on late emerging claims and higher settlements on large losses... -
Page 54
... 12-month terms. Personal auto policies in force increased 4% for 2012, 5% for 2011, and 8% for 2010; policies in force for the special lines products increased 4% in 2012 and 5% in both 2011 and 2010. Net premiums written for personal auto increased 8% in 2012 and 5% in both 2011 and 2010; special... -
Page 55
... written directly by Progressive on the Internet, through mobile devices, and over the phone. Similar to the Agency business, Direct auto new applications were affected by the rate increases taken during 2012 and changes to bill plans that require higher down payments. In addition, lower advertising... -
Page 56
...our policies in this business are written for 12-month terms. Our Commercial Auto business generated double digit growth in net premiums written for 2012, compared to 2011, continuing the growth we began to see in the second half of 2011. We have been increasing rates in our Commercial Auto business... -
Page 57
... but not limited to, personal injury protection, medical payments, uninsured motorist/underinsured motorist (UM/UIM), and bodily injury benefits; rating practices at policy renewal; the utilization, content, or appearance of UM/UIM rejection forms; labor rates paid to auto body repair shops; alleged... -
Page 58
... taxes are comprised of net current income taxes payable/recoverable, which are reported in the balance sheets as part of "other liabilities" in 2012 and "other assets" in 2011, and net deferred tax assets and liabilities. A deferred tax asset/ liability is a tax benefit/expense that is expected to... -
Page 59
... ($ in millions) Cost Fair Value Duration (years) Rating2 2012 Fixed maturities Nonredeemable preferred stocks Short-term investments - other Total fixed-income securities Common equities Total portfolio3,4 2011 Fixed maturities Nonredeemable preferred stocks Short-term investments - other... -
Page 60
...of Total Portfolio ($ in millions) Fair Value 2012 Group I securities: Non-investment-grade fixed maturities Redeemable preferred stocks1 Nonredeemable preferred stocks Common equities Total Group I securities Group II securities: Other fixed maturities2 Short-term investments - other Total Group... -
Page 61
... is managed by maintaining the portfolio's duration between 1.5 and 5 years. Interest rate risk includes the change in value resulting from movements in the underlying market rates of debt securities held. The duration of the fixed-income portfolio was 1.9 years at December 31, 2012 and 2011. The... -
Page 62
... is similarly limited to receiving a below market level coupon for the credit risk premium portion of a similar security as the benchmark variable interest rate adjusts for changes in short-term interest rate levels. Since the beginning of 2011, ten securities that converted from a fixed-rate coupon... -
Page 63
... to non-prime mortgage loans (home equity and Alt-A). Consistent with our plan to add high-quality, short-maturity, fixed-income securities, during 2012, we continued to purchase investment-grade structured securities, primarily in the commercial mortgage-backed and consumer asset-backed markets... -
Page 64
...years ended December 31, 2012, 2011, and 2010, respectively. The following table shows the credit quality rating of our home-equity securities, along with a comparison of the fair value at December 31, 2012, to our original investment value (adjusted for returns of principal, amortization, and write... -
Page 65
... rating of AA+ (excluding the benefit of credit support from bond insurance) for both years. These securities had net unrealized gains of $50.0 million and $63.5 million at December 31, 2012 and 2011, respectively. During the years ended December 31, 2012, 2011, and 2010, we did not record any write... -
Page 66
... exposure to changes in interest rates, at December 31, 2012, compared to 1.6 years at December 31, 2011. The overall credit quality rating was BBB- at December 31, 2012 and 2011. Approximately 30% of our preferred stock securities are fixed-rate securities, and 70% are floating-rate securities. All... -
Page 67
... one manager selected during 2012 with $100 million of authorization. At December 31, 2012, the fair value of the actively managed portfolio was $209.0 million, compared to a cost basis of $193.8 million; neither manager had fully deployed their allocated funds into common stock investments. App... -
Page 68
... we did not have any net realized gains (losses) on trading securities for the years ended December 31, 2012, 2011, and 2010. Derivative Instruments We have invested in the following derivative exposures at various times: interest rate swaps, asset-backed credit default swaps, U.S. corporate credit... -
Page 69
...millions) Term Date Effective Maturity Bought or Sold Protection Notional Value 2012 2011 2010 Open: 5-year Corporate swap Treasury Note1 Total open positions Closed: 2-year 4-year 5-year Corporate swap Treasury Note1 Total closed positions Total corporate swaps 1 Used 09/2008 NA NA 09/2013 NA... -
Page 70
... the years ended December 31, follows: 2012 2011 2010 Fixed-income securities: U.S. Treasury Notes Municipal bonds Corporate bonds Commercial mortgage-backed securities Collateralized mortgage obligations Asset-backed securities Preferred stocks Common stocks: Indexed common stocks Actively managed... -
Page 71
... Write-downs 2012 Residential mortgage-backed securities Commercial mortgage-backed securities Total fixed income Common equities Total portfolio 2011 Residential mortgage-backed securities Commercial mortgage-backed securities Total fixed income Common equities Total portfolio 2010 Residential... -
Page 72
... the collateral. The short-term duration of the transactions (primarily overnight investing) reduces that default exposure. We earned income of $1.0 million, $0.4 million, and $1.2 million on reverse repurchase agreements for the years ended December 31, 2012, 2011, and 2010, respectively. We had... -
Page 73
... personal and commercial auto businesses is not estimated. The actual frequency experienced will vary depending on the change in mix of class of drivers insured by Progressive, but the frequency projections for these lines of business is generally stable in the short term, because a large majority... -
Page 74
... commercial auto physical damage claims and our non-auto lines of business; no change in estimates is presented due to the immaterial level of these reserves. Note: Every percentage point change in our estimate of severity for the 2012, 2011, and 2010 accident years would affect our personal auto... -
Page 75
... in both our personal auto (about 4%) and Commercial Auto (about 6%) businesses through 2012. The favorable development of approximately 5% for 2010 also reflects lower severity estimates for both personal auto and Commercial Auto, but to a lesser extent than the previous two years. For 2011, we... -
Page 76
... rates or equity market declines (e.g., negative return at either a sector index level or at the broader market level); or (iii) credit-related losses, where the present value of cash flows expected to be collected is lower than the amortized cost basis of the security. Fixed-income securities... -
Page 77
..., without limitation, uncertainties related to estimates, assumptions, and projections generally; inflation and changes in economic conditions (including changes in interest rates and financial markets); the possible failure of one or more governmental entities to make scheduled debt payments or... -
Page 78
... Year Summary - Selected Financial Information (unaudited) (millions - except ratios, policies in force, per share amounts, and number of people employed) 2012 2011 2010 2009 2008 Net premiums written Growth Net premiums earned Growth Policies in force (thousands): Personal Lines Growth Commercial... -
Page 79
... except ratios, policies in force, per share amounts, and number of people employed) 2007 2006 2005 2004 2003 Net premiums written Growth Net premiums earned Growth Policies in force (thousands): Personal Lines Growth Commercial Auto Growth Total revenues1 Underwriting margins:2 Personal Lines... -
Page 80
... system. Progressive's common shares are listed on the New York Stock Exchange under the symbol PGR. for 2011 and 2010 have been revised to conform to the 2012 presentation. See the "Revision" section of Note 1 - Reporting and Accounting Policies for further information. annual rate of return... -
Page 81
...the Value Line Property/Casualty Industry Group ("P/C Group") for the last five years. Cumulative Five-Year Total Return* PGR, S&P Index, P/C Group (Performance Results through 12/31/12) $200 PGR S&P Index P/C Group $100 $0 2007 2008 2009 2010 2011 2012 (Assumes $100 was invested at the close of... -
Page 82
..., as well as on a total personal auto basis, in each case calculated from the date of loss. Since physical damage claims pay out so quickly, the chart is calibrated on a monthly basis, as compared to a quarterly basis for the bodily injury and total auto payments. Physical Damage 100% 90% Percent... -
Page 83
... Paid 80% 70% 60% 50% 0 4 8 12 16 Quarters Counts Dollars Note: The above graphs are presented for our personal auto products on an accident period basis and are based on three years of actual experience for physical damage and nine years for bodily injury and total personal auto. App.-A-83 -
Page 84
...value of the financial instruments at December 31, 2012, and the potential for near-term losses from reasonably possible near-term changes in market rates or prices. We had no trading financial instruments at December 31, 2012 and 2011. See Management's Discussion and Analysis of Financial Condition... -
Page 85
...Progressive Corporation and Subsidiaries Net Premiums Written by State (unaudited) ($ in millions) 2012 2011 2010 2009 2008 Florida Texas California New York Georgia Ohio Pennsylvania New....7 341.0 373.7 461.8 5,994.6 12.0% 8.5 7.5 5.4 5.1 4.7 4.1 2.5 2.7 3.4 44.1 100.0% 100.0% $13,604.3 App.-A-85 -
Page 86
...Road Mayfield Village, Ohio 44143 440-461-5000 progressive.com 24-Hour Insurance Quotes, Claims Reporting, and Customer Service Personal autos, motorcycles, and recreational vehicles Commercial autos/trucks To receive a quote To report a claim For customer service: If you bought your policy through... -
Page 87
... support to the Insurance Institute for Highway Safety to further its work in reducing the human trauma and economic costs of auto accidents; and (ii) matching funds to eligible 501(c)(3) charitable organizations to which Progressive employees contribute. Social Responsibility Progressive uses... -
Page 88
... (non-executive) Other Executive Officers John A. Barbagallo Commercial Lines Group President M. Jeffrey Charney Chief Marketing Officer William M. Cody Chief Investment Officer Susan Patricia Griffith Claims Group President Valerie Krasowski Chief Human Resource Officer John P. Sauerland Personal...