Porsche 2014 Annual Report Download - page 57
Download and view the complete annual report
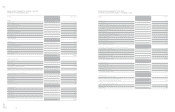
Please find page 57 of the 2014 Porsche annual report below. You can navigate through the pages in the report by either clicking on the pages listed below, or by using the keyword search tool below to find specific information within the annual report.-
 1
1 -
2
-
3
-
4
-
5
-
6
-
7
-
8
-
9
-
10
-
11
-
12
-
13
-
14
-
15
-
16
-
17
-
18
-
19
-
20
-
21
-
22
-
23
-
24
-
25
-
26
-
27
-
28
-
29
-
30
-
31
-
32
-
33
-
34
-
35
-
36
-
37
-
38
-
39
-
40
-
41
-
42
-
43
-
44
-
45
-
46
-
 47
47 -
 48
48 -
 49
49 -
 50
50 -
 51
51 -
 52
52 -
 53
53 -
 54
54 -
 55
55 -
 56
56 -
 57
57 -
 58
58 -
 59
59 -
 60
60 -
 61
61 -
 62
62 -
 63
63 -
 64
64 -
 65
65
 |
 |

110 111
Annual Report
Porsche AG
2014
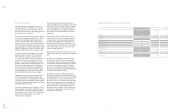
Provisions for pensions and similar obligations rose by
817million euro. The increase resulted mainly from the
change in the German actuarial rate of interest applied
from 3.7percent to 2.3percent.
Non-current other liabilities recorded growth of 370mil-
lion euro. The increase mainly relates to marking deriva-
tive nancial instruments to market.
Current liabilities fell only slightly from 8,561million euro
to 8,511million euro. Current liabilities expressed as
apercentage of total capital declined from 35percent in
the prior year to 33percent as of December 31, 2014.
Current nancial liabilities fell by 1,062million euro. The
reduction resulting from the oset against loan receiva-
bles (see current other receivables) was set against an
increase due to the change in the maturity structure of
the debenture bonds.
Deferred tax liabilities amounted to 684million euro
compared with 719million euro in the prior year.
Trade payables increased to 1,856million euro after
1,485million euro in the previous year. The increase
is attributable to higher volumes of investments and
business.
Current other liabilities amounted to 2,868million euro
(prior year: 2,524million euro).
FINANCIAL POSITION
Cash ows from operating activities came to 3,179mil-
lion euro in the 2014 reporting period following
2,917million euro in the prior year. The significant
factors were an increased prot, depreciation and
amortization, conversely higher income tax payments, and
a higher level of funds tied up in working capital.
The cash ows from investing activities resulted in a
cash outow of 2,248million euro in the reporting period
following 2,090million euro in the prior year. Investments
in intangible assets (excluding development costs capi-
talized) and property, plant and equipment declined from
1,421million euro in the previous year to 1,047million
euro in the period under review. Additions to capitalized
development costs amount to 1,067million euro follow-
ing 815million euro in nancial year 2013.
There was a change in cash ows from nancing activ-
ities from minus 197million euro in the prior year to
minus 978million euro in the most recent nancial year.
The signicant increase in the outow of funds com-
pared with the previous year is mainly attributable to the
payment of 1,414million euro made during the reporting
year in respect of the prot transfer to shareholders. This
was oset by a capital contribution amounting to 829mil-
lion euro made by Porsche Holding Stuttgart GmbH.
The net available liquidity of the automotive division - i.e.
its gross liquidity less nancial liabilities and excluding
the nancial services business in each case - improved
from minus 899million euro as at December 31, 2013 to
195million euro as at December 31, 2014.
Financial
Analysis
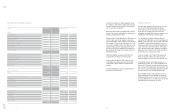
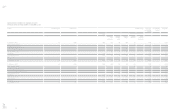
NET ASSETS OF THE PORSCHE AG GROUP
€ million Dec. 31, 2014 %Dec. 31, 2013 %
ASSETS
Intangible assets 2,953 11 2,590 11
Property, plant and equipment 4,087 16 3,935 16
Equity-accounted investments 334 1– –
Other equity investments 23 0306 1
Leased assets 2,294 91,708 7
Receivables from financial services 1,140 51,006 4
Other receivables and assets 8,372 32 8,657 35
Income tax assets 16 025 0
Deferred tax assets 562 2165 1
Non-current assets 19,781 76 18,392 75
Inventories 2,157 81,589 7
Trade receivables 522 2424 2
Receivables from financial services 556 2544 2
Other receivables and assets 1,304 51,933 8
Income tax assets 141 154 0
Securities 39 054 0
Cash and cash equivalents 1,560 61,570 6
Current assets 6,279 24 6,168 25
26,060 100 24,560 100
EQUITY AND LIABILITIES
Equity 9,599 37 9,039 37
Provisions for pensions and similar obligations 2,361 91,544 6
Income tax provisions – – 2 0
Other provisions 811 3715 3
Deferred tax liabilities 684 3719 3
Financial liabilities 3,469 13 3,725 15
Other liabilities 625 2255 1
Non-current liabilities 7,950 30 6,960 28
Income tax provisions 80 052 0
Other provisions 1,337 51,214 5
Financial liabilities 1,884 82,946 12
Trade payables 1,856 71,485 7
Other liabilities 2,868 11 2,524 10
Income tax liabilities 486 2340 1
Current liabilities 8,511 33 8,561 35
26,060 100 24,560 100