Pioneer 2012 Annual Report Download - page 15
Download and view the complete annual report
Please find page 15 of the 2012 Pioneer annual report below. You can navigate through the pages in the report by either clicking on the pages listed below, or by using the keyword search tool below to find specific information within the annual report.-
 1
1 -
2
-
3
-
4
-
 5
5 -
 6
6 -
 7
7 -
 8
8 -
 9
9 -
 10
10 -
 11
11 -
 12
12 -
 13
13 -
 14
14 -
 15
15 -
 16
16 -
 17
17 -
 18
18 -
 19
19 -
 20
20 -
 21
21 -
 22
22 -
 23
23 -
 24
24 -
 25
25 -
26
-
27
-
28
-
29
-
30
-
31
-
32
-
33
-
34
-
35
-
36
-
37
-
38
-
39
-
40
-
41
-
42
-
43
-
44
-
45
-
46
-
47
-
48
-
49
-
50
-
51
-
52
-
53
-
54
-
55
-
56
-
57
-
58
 |
 |

In the Others segment, sales declined 6.4% year on
year, to ¥42.9 billion, on lower sales of electronic
devices and parts, speaker units for cellular phones,
and organic light-emitting diode (OLED) displays,
despite increased sales of factory automation systems
and map software, and an increase in royalty revenue
from patents related to optical disc technologies.
By geographic region, sales in Japan declined
5.6%, to ¥27.4 billion, and overseas sales were
down 7.7%, to ¥15.5 billion.
This segment recorded an operating loss of ¥0.3
billion, compared with operating income of ¥0.1 billion
in fiscal 2011, from a lower gross profit margin and
the decline in sales, despite lower SG&A expenses.
Note: Operating income (loss) in each business segment represents the operating income (loss) before elimination of intersegment
transactions.
Main Products and Services
n Factory Automation Systems n Speaker Units
n Electronic Devices and Parts
n Organic Light-Emitting Diode Displays n Telephones
n Business-use AV Systems n Map Software
n Licensing of Patents Related to Laser Optical Disc Technologies
60
40
20
0
36.2 29.0 27.4
17.9
16.8 15.5
54.1
45.9 42.9
2010 2011 2012
Net Sales (Billion yen) Overseas
Japan
1.0
0.5
0
-0.5
2010 2011 2012
0.7
0.1
-0.3
Operating Income (Loss) (Billion yen)
Others
Japan North America Europe Other Regions
2010 2011 2012 2010 2011 2012 2010 2011 2012 2010 2011 2012
182.1
220.0
250
222.0
72.7 68.2 67.3
61.0
50.3 49.8
123.2119.1
97.7
100100150
Sales by Geographic Markets (Billion yen)
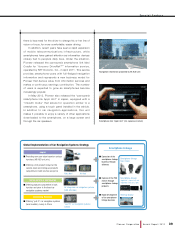
Map software for smartphone
13
Pioneer Corporation Annual Report 2012