Pepsi 2007 Annual Report Download - page 3
Download and view the complete annual report
Please find page 3 of the 2007 Pepsi annual report below. You can navigate through the pages in the report by either clicking on the pages listed below, or by using the keyword search tool below to find specific information within the annual report.-
 1
1 -
 2
2 -
 3
3 -
 4
4 -
 5
5 -
 6
6 -
 7
7 -
 8
8 -
 9
9 -
 10
10 -
 11
11 -
 12
12 -
 13
13 -
 14
14 -
15
-
16
-
17
-
18
-
19
-
20
-
21
-
22
-
23
-
24
-
25
-
26
-
27
-
28
-
29
-
30
-
31
-
32
-
33
-
34
-
35
-
36
-
37
-
38
-
39
-
40
-
41
-
42
-
43
-
44
-
45
-
46
-
47
-
48
-
49
-
50
-
51
-
52
-
53
-
54
-
55
-
56
-
57
-
58
-
59
-
60
-
61
-
62
-
63
-
64
-
65
-
66
-
67
-
68
-
69
-
70
-
71
-
72
-
73
-
74
-
75
-
76
-
77
-
78
-
79
-
80
-
81
-
82
-
83
-
84
-
85
-
86
-
87
-
88
-
89
-
90
 |
 |

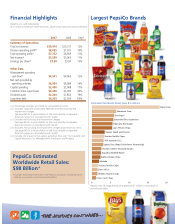
Financial Highlights
PepsiCo, Inc. and Subsidiaries
($ in millions except per share amounts; all per share amounts assume dilution)
2007 2006 Chg(a)
Summary of Operations
Total net revenue $39,474 $35,137 12%
Division operating profit(b) $8,025 $7,307 10%
Total operating profit(c) $7,272 $6,569 11%
Net income(d) $5,599 $5,065 11%
Earnings per share(d) $3.38 $3.00 13%
Other Data
Management operating
cash flow(e) $4,551 $4,065 12%
Net cash provided by
operating activities $6,934 $6,084 14%
Capital spending $2,430 $2,068 17%
Common share repurchases $4,300 $3,000 43%
Dividends paid $2,204 $1,854 19%
Long-term debt $4,203 $2,550 65%
( a ) Percentage changes are based on unrounded amounts.
( b ) Excludes corporate unallocated expenses and restructuring and
impairment charges.
See page 86 for a reconciliation to the most directly comparable
financial measure in accordance with GAAP.
( c ) Excludes restructuring and impairment charges.
See page 86 for a reconciliation to the most directly comparable
financial measure in accordance with GAAP.
( d ) Excludes restructuring and impairment charges and certain tax items.
See page 86 for a reconciliation to the most directly comparable
financial measure in accordance with GAAP.
( e ) Includes the impact of net capital spending. Also, see “Our Liquidity and
Capital Resources” in Management’s Discussion and Analysis.
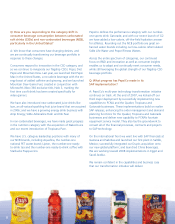
Pepsi-Cola
Mountain Dew
Diet Pepsi
Gatorade Thirst Quencher
Lay’s Potato Chips
Lipton Teas (PepsiCo/Unilever Partnership)
Tropicana Beverages
Doritos Tortilla Chips
7UP (outside U.S.)
Aquafina Bottled Water
Cheetos Cheese Flavored Snacks
Quaker Foods and Snacks
Ruffles Potato Chips
Mirinda
Tostitos Tortilla Chips
Sierra Mist
Fritos Corn Chips
Walkers Potato Crisps
0 5 10 15 20
Estimated Worldwide Retail Sales $ in Billions
PepsiCo has 18 mega-brands that generate $1 billion or more each in
annual retail sales.
Largest PepsiCo Brands
PepsiCo Estimated
Worldwide Retail Sales:
$98 Billion*
* Includes estimated retail sales of all PepsiCo products, including those
sold by our partners and franchised bottlers.
1