Pepsi 2007 Annual Report Download
Download and view the complete annual report
Please find the complete 2007 Pepsi annual report below. You can navigate through the pages in the report by either clicking on the pages
listed below, or by using the keyword search tool below to find specific information within the annual report.
-
1
-

2
-
3
-
4
-

5
-
6
-

7
-
8
-
9
-
10
-

11
-

12
-
13
-
14
-
15
-
16
-
17
-
18
-
19
-
20
-
21
-
22
-
23
-
24
-
25
-
26
-
27
-
28
-
29
-
30
-
31
-
32
-
33
-
34
-
35
-
36
-
37
-
38
-
39
-
40
-
41
-
42
-
43
-
44
-
45
-
46
-
47
-
48
-
49
-
50
-
51
-
52
-
53
-
54
-
55
-
56
-
57
-
58
-
59
-
60
-
61
-
62
-
63
-
64
-
65
-
66
-
67
-
68
-
69
-
70
-
71
-
72
-
73
-
74
-
75
-
76
-
77
-
78
-
79
-
80
-
81
-
82
-
83
-
84
-
85
-
86
-
87
-
88
-
89
-
90
Table of contents
-
Page 1
-
Page 2
...
1 ...Financial Highlights 2 ...Letter to Shareholders 7 ...Questions & Answers 10...Leadership Team 12...PepsiCo Americas Foods 14...PepsiCo Americas Beverages 16...PepsiCo International 19...Purpose: Human, Environment, Talent 29...PepsiCo Board of Directors 30...Executive Officers 31...Financial...
-
Page 3
...
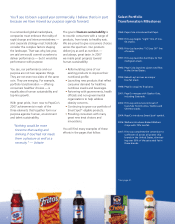
Largest PepsiCo Brands
2007 Summary of Operations Total net revenue Division operating profit(b) Total operating profit(c) Net income(d) Earnings per share(d) Other Data Management operating cash flow(e) Net cash provided by operating activities Capital spending Common share repurchases Dividends...
-
Page 4
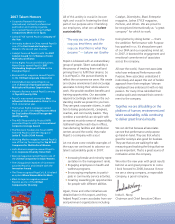
...am delighted to share with you the following 2007 financial results:
• Net revenue grew 12%, roughly three times the rate of global GDP growth. • Division operating profit grew 10%.* • Earnings per share grew 13%.* • Total return to shareholders was 26%. • Return on invested capital was 29...
-
Page 5
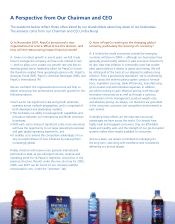
... businesses from the leaders of PepsiCo Americas Foods, PepsiCo Americas Beverages and PepsiCo International.
Earnings Per Share*
$3.38 $3.00 $2.66
2005
2006
2007
*See page 86.
Management Operating Cash Flow**
$ in Millions
$4,551 $4,204 $4,065
2007 Scorecard
12% 4% Volume Net Revenue...
-
Page 6
...: Frito-Lay launches "1/3 Less Oil" line of snacks. 1991: Frito-Lay launches SunChips, its first multigrain snack. 1992: Pepsi-Cola launches Lipton Iced Teas in the United States. 1995: Baked Lay's arrives as a major low-fat snack. 1998: PepsiCo acquires Tropicana. 2001: PepsiCo merges with Quaker...
-
Page 7
... energy, and working out ways to communicate our conservation efforts through brand marketing activities. • Offsetting the total purchased electricity used by all PepsiCo U.S.-based facilities, by purchasing renewable energy certificates. These initiatives pay. Since 1999, Frito-Lay North America...
-
Page 8
... employees in health and wellness programs. • Encouraging employees to participate in community service activities. • Creating rewarding job opportunities for people with different abilities. Again, these and other initiatives are detailed later in this report, and they helped PepsiCo earn...
-
Page 9
... our growth rate and also to develop global senior leadership talent for PepsiCo's future. We therefore created three operating business units: PepsiCo Americas Foods (PAF), PepsiCo Americas Beverages (PAB), and PepsiCo International (PI). We are confident this organizational structure will help us...
-
Page 10
.... In non-carbonated beverages, we have made great progress in the nutrition category with the acquisition of Naked Juice and our recent introduction of Tropicana Pure. We have U.S. category leadership positions with many of our NCB brands, including Aquafina, the number-one national PET water brand...
-
Page 11
... Industry Groups (Non-Alcoholic Beverages and Food) by PepsiCo's sales in its beverage and foods businesses. The return on PepsiCo stock investment is calculated through December 28, 2007, the last trading day prior to the end of PepsiCo's fiscal year. The return for the S&P 500 and the S&P Average...
-
Page 12
...PepsiCo Beverages North America and all of our Latin America beverage businesses. 3) PepsiCo International (PI), which includes all PepsiCo businesses in the United Kingdom, Europe, Asia, Middle East and Africa.
The financial section of this annual report (pages 31-86) is based on the 2007 reporting...
-
Page 13
...Latin America Beverages 27 Chris Furman President PepsiCo Foodservice 5 Neil Campbell President Tropicana
PepsiCo International
7 Michael D. White Chief Executive Officer PepsiCo International Vice Chairman, PepsiCo 1 Tim Minges President PepsiCo Asia Pacific 9 Zein Abdalla President PepsiCo Europe...
-
Page 14
... like Frito-Lay and Quaker Foods in North America, Sabritas and Gamesa in Mexico and Elma Chips in Brazil. Collectively, they market and sell some of the world's most popular snack and food brands.
These businesses have been making major contributions to PepsiCo's growth for many years.
Our success...
-
Page 15
... new PAF structure provides opportunities to quickly share best practices and scale regional successes. We have a terrific team of diverse and devoted
Frito-Lay North America 36% Latin America Foods 9% Middle East/ Africa/Asia 7% UK/Europe 10% PAB 31%
John Compton CEO, PepsiCo Americas Foods
PAF...
-
Page 16
...beverage, Gatorade Tiger, the first product in the new line, hit store shelves in March 2008. • Leveraging consumers' inherent love of bubbles, we also have been working to reinvent carbonated soft drinks and provide greater variety in North America. Diet Pepsi Max, for example, is a great-tasting...
-
Page 17
...d'Amore CEO, PepsiCo Americas Beverages
PAB comprises 28% of PepsiCo Net Revenue
PepsiCo Division Operating Profit: $7,923
PepsiCo, Inc. and Subsidiaries $ in millions
PAB 31% UK/ Europe 10% Frito-Lay North America 36% Middle East/ Africa/Asia 7% Latin America Foods 9%
Quaker Foods North America...
-
Page 18
... major investments to transform our information systems and capability to be better equipped to support and enable further growth.
• In the Middle East, zero-calorie Pepsi Max posted strong growth, and Mountain Dew surged ahead in markets like Nigeria and Pakistan; the Lay's brand helped drive...
-
Page 19
... core values of PepsiCo.
We are deeply committed to Performance with Purpose and operating in sustainable ways that benefit our shareholders, employees, business partners and the communities we serve.
Latin America Foods 9% Quaker Foods North America 7%
Michael D. White Vice Chairman, PepsiCo CEO...
-
Page 20
... flow of innovative and customized product solutions. We then leverage our portfolio to drive sales and profit growth for PepsiCo and our retail partners by offering relevant products and targeted programs to consumers in a more localized way worldwide." - Tom Greco, President, PepsiCo Sales
18
-
Page 21
... on each of these priorities, from our industry-leading product labeling with the Smart Spot program in 2004, to last year's purchase of renewable energy certificates, to our 2008 launch of PepsiCo University to develop tomorrow's multicultural/multigenerational leaders. As a member of the Dow...
-
Page 22
...tastes great and helps them stay on track. Mini Delights bring three new benefits to the snack category: taste indulgence, 90-calorie portion packs and plenty of pieces in every pouch.
• Our Gamesa-Quaker business in Mexico launched a new line of oat-based cookies and snacks, and our South Africa...
-
Page 23
... full-calorie soft drinks from K-12 schools in the United States over three years. One year into our commitment, we have seen more than a 40% drop in the calories of beverages shipped to these schools.
Supporting Research and Development
The PepsiCo Foundation is deeply engaged in developing new...
-
Page 24
... The program will impact one million children in 3,000 schools throughout Mexico.
The PepsiCo Blue Ribbon Advisory Board delivers high-level, independent insight about major health and wellness policies. It also offers science-based perspectives on product transformation, labeling and marketing and...
-
Page 25
... energy the plant uses to make SunChips snacks in that location. As a six-year member of the Frito-Lay sales organization, I'm glad to work for a company that is finding many ways to use renewable energy." - Carrie Carroll, National Account Manager, Frito-Lay North America 2007 PepsiCo President...
-
Page 26
... by all of PepsiCo U.S.-based manufacturing facilities, headquarters, distribution centers and regional offices.
Our three-year purchase of more than one billion kilowatt-hours annually is the same amount of electricity needed to power nearly 90,000 average American homes annually, as estimated by...
-
Page 27
... in other regions went live last year as well. PepsiCo India launched our
international community to address water issues both in our own operations and our supply chain. We also affirmed support for the UN Millennium Development goals, which have wide-ranging ramifications for water programs. In...
-
Page 28
... introduced the PepsiCo Leadership and Individual Effectiveness Model in 2007. By communicating what's important at PepsiCo and what we value from each of our associates, we are helping to shape an unrivaled corporate environment that provides our company with the ultimate competitive advantage. The...
-
Page 29
...thank you" videos posted on YouTube by the deaf community and mentions in over 3,000 blogs after it aired. Pictured left to right: "Bob's House" creator, Clay Broussard, Project Manager, PepsiCo Customer Supply Chain & Logistics; co-stars, Brian Dowling, Warehouser II, Frito-Lay North America; Sheri...
-
Page 30
... 2008)
"As a founding member of the PepsiCo Latino/Hispanic Advisory Board, I am honored to represent a group that provides the company with diverse points of view, which benefit consumers, PepsiCo and the communities in which it operates. These perspectives influence new products and marketing...
-
Page 31
... Financial Services 62. Elected 2003. 8 Daniel Vasella Chairman of the Board and Chief Executive Officer Novartis AG 54. Elected 2002. 4 Michael D. White Chief Executive Officer PepsiCo International Vice Chairman PepsiCo 56. Elected 2006.
Listings include age and year elected as a PepsiCo director...
-
Page 32
... Purchase, NY 10577 914-253-2000 John C. Compton Chief Executive Officer PepsiCo Americas Foods Massimo F. d'Amore Chief Executive Officer PepsiCo Americas Beverages Richard Goodman Chief Financial Officer Hugh Johnston President Pepsi-Cola North America Lionel L. Nowell III Senior Vice President...
-
Page 33
... Financial Information ...82 Results of Operations - Division Review ...49 Frito-Lay North America ...50 PepsiCo Beverages North America...51 PepsiCo International ...52 Quaker Foods North America ...53 Our Liquidity and Capital Resources ...54
MANAGEMENT'S RESPONSIBILITY FOR FINANCIAL REPORTING...
-
Page 34
... ï¬nished goods, under various beverage brands including Pepsi, Mountain Dew, Gatorade, Tropicana Pure Premium, Sierra Mist, Propel, Tropicana juice drinks, Dole, SoBe Life Water, Naked juice and Izze. PBNA also manufactures or uses contract manufacturers, markets and sells ready-to-drink
PepsiCo...
-
Page 35
... PepsiCo International (PI), which includes all PepsiCo businesses in the United Kingdom, Europe, Asia, Middle East and Africa.
Quaker Foods North America
Quaker Foods North America (QFNA) manufactures or uses contract manufacturers, markets and sells cereals, rice, pasta and other branded products...
-
Page 36
...less costly systems generally work
Our Competition
Our businesses operate in highly competitive markets. We compete against global, regional, local and private label manufacturers on the basis of price, quality, product variety and distribution. In U.S. measured channels, we have a similar share of...
-
Page 37
...consistent with terms negotiated with other vendors and customers. In addition, certain of our employees serve on the boards of our anchor bottlers and other afï¬liated companies and do not receive incremental compensation for their Board services.
Our Business Risks
Demand for our products may be...
-
Page 38
...these raw materials and supplies are available from a limited number of suppliers. We are exposed to the market risks arising from adverse changes in commodity prices, affecting the cost of our raw materials and energy. The raw materials and energy which we use for the production of our products are...
-
Page 39
... 31% of our 2007 North American net revenue, with Wal-Mart (including Sam's) representing approximately 18%. These percentages include concentrate sales to our bottlers which are used in ï¬nished goods sold by them to these retailers. Loss of any of our key customers, including Wal-Mart...
-
Page 40
...• commodity prices, affecting the cost of our raw materials and energy, • foreign exchange rates, and • interest rates.
In the normal course of business, we manage these risks through a variety of strategies, including productivity initiatives, global purchasing programs and hedging strategies...
-
Page 41
... raw material and energy costs through our hedging strategies and ongoing productivity initiatives.
Exchange rate gains or losses related to foreign currency transactions are recognized as transaction gains or losses in our income statement as incurred. We may enter into derivatives to manage our...
-
Page 42
... generally within 30 to 90 days internationally, and may allow discounts for early payment. We recognize revenue upon shipment or delivery to our customers based on written sales terms that do not allow for a right of return. However, our policy for DSD and chilled products is to remove and replace...
-
Page 43
..., such as forecasted growth rates and our cost of capital, are based on the best available market information and are consistent with our internal forecasts and operating plans. These assumptions could be adversely impacted by certain of the risks discussed in "Our Business Risks." We did not...
-
Page 44
... tax planning opportunities available to us in the various jurisdictions in which we operate. Signiï¬cant judgment is required in determining our annual tax rate and in evaluating our tax positions. We establish reserves when, despite our belief that our tax return positions are fully supportable...
-
Page 45
... employee-related factors, such as turnover, retirement age and mortality; • for pension expense, the expected return on assets in our funded plans and the rate of salary increases for plans where beneï¬ts are based on earnings; and • for retiree medical expense, health care cost trend rates...
-
Page 46
...-average assumptions for pension and retiree medical expense are as follows: 2008 2007 Pension Expense discount rate 6.3% 5.7% Expected rate of return on plan assets 7.6% 7.7% Expected rate of salary increases 4.4% 4.5% Retiree medical Expense discount rate 6.4% 5.8% Current health care cost trend...
-
Page 47
...impact on 2008 pension expense of a 25-basispoint decrease in the expected rate of return is an increase of approximately $17 million. See Note 7 regarding the sensitivity of our retiree medical cost assumptions.
Future Funding
We make contributions to pension trusts maintained to provide plan bene...
-
Page 48
...million, substantially all of which related to the Internal Revenue Service's (IRS) examination of our consolidated tax returns for the years 1998 through 2002.
PepsiCo Share of PBG Tax Settlement
In 2006, the IRS concluded its examination of PBG's consolidated income tax returns for the years 1999...
-
Page 49
... the costs of our corporate headquarters, centrally managed initiatives, such as our ongoing business transformation initiative in North America, unallocated insurance and beneï¬t programs, foreign exchange transaction gains and losses, and certain commodity derivative gains and losses, as well as...
-
Page 50
... impact of certain other corporate items.
Other Consolidated Results
Change Bottling equity income Interest expense, net Annual tax rate Net income Net income per common share - diluted Bottling equity income includes our share of the net income or loss of our anchor bottlers as described in "Our...
-
Page 51
... to non-consolidated joint venture volume and temporary timing differences between BCS and CSE. Our net revenue for PBNA and PI excludes nonconsolidated joint venture volume and is based on CSE. (b) Includes the year-over-year impact of discrete pricing actions, sales incentive activities and mix...
-
Page 52
... by higher commodity costs, as well as increased advertising and marketing expenses. Operating proï¬t beneï¬ted almost 2 percentage points from the
Net revenue grew 5% reï¬,ecting volume growth of 1% and positive effective net pricing due to salty snack pricing actions and favorable mix. Pound...
-
Page 53
...the low-single-digit range. as bottler volume is reported based on a calendar month. Net revenue grew 5%. Positive mix contributed to the revenue growth, reï¬,ecting the strength of non-carbonated beverages. Price increases taken in 2006, primarily on concentrate, Tropicana Pure Premium and fountain...
-
Page 54
...and the Latin America region grew 7%. Acquisitions contributed 1 percentage point to the Europe, Middle East & Africa region volume growth rate and contributed slightly to the reported total PepsiCo International beverage volume growth rate. CSDs grew at a high-single-digit rate while non-carbonated...
-
Page 55
...and volume growth by approximately 2 percentage points. Operating proï¬t increased 3% primarily reï¬,ecting the net revenue growth. Increased cost of sales, primarily driven
by higher raw material and energy costs, were largely offset by lower advertising and marketing expenses. The absence of the...
-
Page 56
... America to support growth in key trademarks, and investments in our ongoing business transformation initiative. New capital projects are evaluated on a case-by-case basis and must meet certain payback and internal rate of return targets.
Short-term investments $383 Acquisitions $1,320 Dividends...
-
Page 57
...Sales of property, plant and equipment Management operating cash flow
2007 $ 6,934 (2,430) 47 $ 4,551
2006 $ 6,084 (2,068) 49 $ 4,065
2005 $ 5,852 (1,736) 88 $ 4,204
Management Operating Cash Flow
We focus on management operating cash ï¬,ow as a key element in achieving maximum shareholder value...
-
Page 58
...Statement of Income
PepsiCo, Inc. and Subsidiaries Fiscal years ended December 29, 2007, December 30, 2006 and December 31, 2005 (in millions except per share amounts) Net Revenue ...Cost of sales ...Selling, general and administrative expenses...Amortization of intangible assets ...Operating Profit...
-
Page 59
... other current liabilities ...500 Change in income taxes payable...128 Other, net ...(107) Net Cash Provided by Operating Activities ...6,934 Investing Activities Capital spending ...(2,430) 47 Sales of property, plant and equipment ...Proceeds from (Investment in) finance assets ...27 Acquisitions...
-
Page 60
Consolidated Balance Sheet
PepsiCo, Inc. and Subsidiaries December 29, 2007 and December 30, 2006 (in millions except per share amounts) ASSETS Current Assets Cash and cash equivalents ...Short-term investments ...Accounts and notes receivable, net ...Inventories ...Prepaid expenses and other ...
-
Page 61
... 158 ...Pension and retiree medical, net of tax: Net pension and retiree medical gains ...Reclassification of net losses to net income...Minimum pension liability adjustment, net of tax . . Unrealized gain on securities, net of tax ...Other ...Balance, end of year ...Repurchased Common Stock Balance...
-
Page 62
... operating results, to be consistent with PepsiCo's internal management accountability. Prior period amounts have been adjusted to reï¬,ect this reclassiï¬cation. Raw materials, direct labor and plant overhead, as well as purchasing and receiving costs, costs directly related to production planning...
-
Page 63
... the new structure. The segment amounts and discussions reï¬,ected in this annual report reï¬,ect the management reporting that existed through ï¬scal yearend 2007.
Frito-Lay North America (FLNA)
PepsiCo Beverages North America (PBNA)
PepsiCo International (PI)
Quaker Foods North America (QFNA...
-
Page 64
... revenue from businesses operating in these countries. (b) Long-lived assets represent property, plant and equipment, nonamortizable intangible assets, amortizable intangible assets, and investments in noncontrolled affiliates. These assets are reported in the country where they are primarily used...
-
Page 65
... and related beneï¬ts for employees who are directly associated with the software project and (iii) interest costs incurred while developing internal-use computer software. Capitalized software costs are included in property, plant and equipment on our balance sheet and amortized on a straight-line...
-
Page 66
... on brands and goodwill, see "Our Critical Accounting Policies" in Management's Discussion and Analysis. • Income Taxes - Note 5, and for additional unaudited information, see "Our Critical Accounting Policies" in Management's Discussion and Analysis. • Pension, Retiree Medical and Savings Plans...
-
Page 67
...to Corporate. Most of this charge related to the termination
of approximately 700 employees. As of December 30, 2006, all terminations had occurred, and as of December 29, 2007, no accrual remains.
Note 4 - Property, Plant and Equipment and Intangible Assets
Average Useful Life Property, plant and...
-
Page 68
... for revision. For additional unaudited information on our amortizable brand policies, see "Our Critical Accounting Policies" in Management's Discussion and Analysis.
Nonamortizable Intangible Assets
Perpetual brands and goodwill are assessed for impairment at least annually. If the carrying amount...
-
Page 69
... ...Property, plant and equipment ...Intangible assets other than nondeductible goodwill ...Pension benefits...Other ...Gross deferred tax liabilities ...Deferred tax assets Net carryforwards...Stock-based compensation ...Retiree medical benefits ...Other employee-related benefits...Pension benefits...
-
Page 70
... outside the U.S. and recorded income tax expense of $460 million related to the AJCA. The AJCA created a one-time incentive for U.S. corporations to repatriate undistributed international earnings by providing an 85% dividends received deduction.
Reserves
A number of years may elapse before...
-
Page 71
... program in connection with their service on our Board. Beginning in 2007, members of our Board of Directors no longer receive stock-based compensation grants. Stock options and restricted stock units (RSU) are granted to employees under the shareholder-approved 2007 Long-Term Incentive Plan...
-
Page 72
... recent historical period equivalent to the expected life. Dividend yield is estimated over the expected life based on our stated dividend policy and forecasts
of net income, share repurchases and stock price. A summary of our stock-based compensation activity for the year ended December 29, 2007...
-
Page 73
... Pension, Retiree Medical and Savings Plans
Our pension plans cover full-time employees in the U.S. and certain international employees. Beneï¬ts are determined based on either years of service or a combination of years of service and earnings. U.S. and Canada retirees are also eligible for medical...
-
Page 74
... service cost/(credit) $1,292 $1,849 Total Components of the (decrease)/increase in net loss $ (292) $(123) Change in discount rate - (45) Employee-related assumption changes (17) 5 Liability-related experience different from assumptions (255) (122) Actual asset return different from expected return...
-
Page 75
... comprehensive loss into beneï¬t expense in 2008 for our pension and retiree medical plans are as follows: Pension Retiree Medical Net loss Prior service cost/(credit) Total U.S. $56 20 $76 International $20 3 $23 $ 7 (12) $ (5)
The following table provides the weighted-average assumptions used to...
-
Page 76
...2008. This average increase is then projected to decline gradually to 5% in 2014 and thereafter. These assumed health care cost trend rates have an impact on the retiree medical plan expense and liability. However, the cap on our share of retiree medical costs limits the impact. A 1-percentage-point...
-
Page 77
2007 service and interest cost components 2007 benefit liability
1% Increase 1% Decrease $5 $(4) $55 $(48) For additional unaudited information on our pension and retiree medical plans and related accounting policies and assumptions, see "Our Critical Accounting Policies" in Management's Discussion...
-
Page 78
... non-carbonated beverages. We also sell certain ï¬nished goods to these 2007 $4,874 $91 $163 $106 2006 $4,837 $87 $175 $62 2005 $4,633 $143
afï¬liates, and we receive royalties for the use of our trademarks for certain products. Sales of concentrate and ï¬nished goods are reported net of bottler...
-
Page 79
... agreement may be used for general corporate purposes, including supporting our outstanding commercial paper issuances. This line of credit remains unused as of December 29, 2007. In the third quarter of 2007, we updated our U.S. $2.5 billion euro medium term note program following the expiration...
-
Page 80
... information on our borrowings.
Note 10 - Risk Management
We are exposed to market risks arising from adverse changes in: • commodity prices, affecting the cost of our raw materials and energy, • foreign exchange risks, and • interest rates. In the normal course of business, we manage...
-
Page 81
... market prices. Book and fair values of our derivative and ï¬nancial instruments are as follows:
2007 Book Value Assets Cash and cash equivalents(a) Short-term investments(b) Forward exchange contracts(c) Commodity contracts(d) Prepaid forward contracts(e) Interest rate swaps(f) Cross currency...
-
Page 82
... available to common shareholders divided by the weighted average of common shares outstanding during the period. Diluted net income per common share is calculated using the weighted average of common shares outstanding adjusted to include the effect that would occur if in-the-money employee stock...
-
Page 83
... results from items deferred from recognition into our income statement. Accumulated other comprehensive loss is separately presented on our balance sheet as part of common shareholders' equity. Other comprehensive income/(loss) was $1,294 million in 2007, $456 million in 2006 and $(167) million in...
-
Page 84
...14 - Supplemental Financial Information
2007 Accounts receivable Trade receivables Other receivables Allowance, beginning of year Net amounts charged/(credited) to expense Deductions(a) Other(b) Allowance, end of year Net receivables Inventories(c) Raw materials Work-in-process Finished goods $3,670...
-
Page 85
... likely to materially affect, our internal control over ï¬nancial reporting during our fourth ï¬scal quarter of 2007.
Peter A. Bridgman Senior Vice President and Controller
Richard Goodman Chief Financial Ofï¬cer
Indra K. Nooyi Chairman of the Board of Directors and Chief Executive Ofï¬cer...
-
Page 86
... Public Accounting Firm
The Board of Directors and Shareholders PepsiCo, Inc.:
We have audited the accompanying Consolidated Balance Sheet of PepsiCo, Inc. and Subsidiaries ("PepsiCo, Inc." or the "Company") as of December 29, 2007 and December 30, 2006, and the related Consolidated Statements...
-
Page 87
... sales price and quarterly closing prices for one share of PepsiCo common stock.
Five-Year Summary Net revenue Net income Income per common share - basic Income per common share - diluted Cash dividends declared per common share Total assets Long-term debt Return on invested capital(a)
2007 2006...
-
Page 88
...10% Operating Profit Reconciliation Frito-Lay North America Operating Profit Quaker Foods North America Operating Profit Latin America Foods Operating Profit PepsiCo Americas Beverages Operating Profit United Kingdom & Europe Operating Profit Middle East, Africa & Asia Operating Profit PepsiCo Total...
-
Page 89
... growth rate of 14%. The closing price for a share of PepsiCo common stock on the New York Stock Exchange was the price as reported by Bloomberg for the years ending 2003-2007. Past performance is not necessarily indicative of future returns on investments in PepsiCo common stock.
Cash Dividends...
-
Page 90