Omron 2010 Annual Report Download - page 16
Download and view the complete annual report
Please find page 16 of the 2010 Omron annual report below. You can navigate through the pages in the report by either clicking on the pages listed below, or by using the keyword search tool below to find specific information within the annual report.-
 1
1 -
2
-
3
-
4
-
5
-
 6
6 -
 7
7 -
 8
8 -
 9
9 -
 10
10 -
 11
11 -
 12
12 -
 13
13 -
 14
14 -
 15
15 -
 16
16 -
 17
17 -
 18
18 -
 19
19 -
 20
20 -
 21
21 -
 22
22 -
 23
23 -
 24
24 -
 25
25 -
 26
26 -
27
-
28
-
29
-
30
-
31
-
32
-
33
-
34
-
35
-
36
-
37
-
38
-
39
-
40
-
41
-
42
-
43
-
44
-
45
-
46
-
47
-
48
-
49
-
50
-
51
-
52
-
53
-
54
-
55
-
56
-
57
-
58
-
59
-
60
-
61
-
62
-
63
-
64
-
65
-
66
-
67
-
68
-
69
-
70
-
71
-
72
-
73
-
74
-
75
-
76
-
77
-
78
-
79
-
80
-
81
-
82
-
83
-
84
-
85
-
86
-
87
-
88
-
89
-
90
-
91
-
92
-
93
-
94
-
95
-
96
-
97
-
98
-
99
-
100
-
101
-
102
-
103
-
104
-
105
-
106
-
107
-
108
-
109
-
110
-
111
-
112
 |
 |

In fiscal 2009, the Omron Group achieved a significant year-on-year increase
in earnings thanks to united efforts including fixed cost reductions. This
was despite our initial forecasts of a substantial decline in profits due to
the impact of the global economic crisis. In fiscal 2010, we will seek to
become leaner to “build a robust earnings structure” while “changing gears
to high growth.”
16
To Our Stakeholders
Message from the President
Fiscal 2009 in Review
Since the autumn of 2009, the world economy has
showed signs of moderate recovery, driven by China
and other emerging nations, as well as the benefits of
economic stimulus measures adopted by various
countries. Similarly, from the second quarter capital
expenditure-related demand has been gradually pick-
ing up in our main customer segments in the industrial
sector, especially automobiles and electronic com-
ponents.
In this environment, the Omron Group took advan-
tage of consumption stimulus measures in various
nations and recovery in capital expenditure-related
demand in its core businesses to achieve a recovery in
revenue. This was evidenced by sales recovery in the
Electronic and Mechanical Components Business
(EMC), Automotive Electronic Components Business
(AEC), and Industrial Automation Business (IAB).
Although the Social Systems Solutions Business (SSB)
struggled due to the completion of railway infrastruc-
ture system renewals and investment restraints, the
Healthcare Business (HCB) posted a solid perform-
ance owing to several factors. These included growth
in demand for digital thermometers following the out-
break of the H1N1 influenza virus, as well as steady
sales of blood pressure monitors amid rising health-
consciousness in China and elsewhere in Asia.
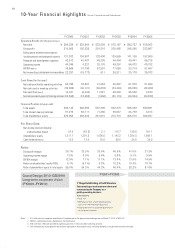
Consolidated net sales declined 16.3% year-on-
year, to ¥524.7 billion, impacted by a substantial
decline in demand until the second quarter of the
period. However, we surpassed our initial net sales
target of ¥510.0 billion by ¥14.7 billion, thanks to the
performances of our IAB, EMC, and AEC business-
es—where recovery exceeded our expectations.
With respect to earnings, we achieved cuts in fixed
and variable costs amounting to around ¥63.0 billion.
As a result, despite the considerable fall in revenue,
we posted operating income of ¥13.1 billion, up
144.9% year-on-year, and net income attributable to
shareholders of ¥3.5 billion, compared with a net loss
attributable to shareholders of ¥29.2 billion in the pre-
vious fiscal year.
Fiscal 2010 Outlook
In fiscal 2010, we expect business conditions to con-
tinue recovering, but we cannot be optimistic across
the board. In addition to the ongoing high level of
unemployment rates in advanced nations, for exam-
ple, there are concerns that the benefits of economic
stimulus measures will start fading in the second half
of the period. Meanwhile, amid worsening fiscal insta-
bility in Europe, triggered by the recent financial crisis
in Greece, the outlook remains uncertain. Having said
that, we anticipate continued economic growth in
Consolidated Operating Income by Segment
IAB
EMC
AEC
SSB
HCB
Other
Eliminations & corporate
Total
18.2
4.2
(7.1)
5.2
4.8
(7.3)
(12.6)
5.3
FY2008
13.9
6.7
1.7
2.7
7.1
(7.0)
(12.0)
13.1
FY2009
FY2008
Actual
(Billions of yen)
Consolidated Operating Income Analysis (YoY)
FY2009
Actual
5.3
13.1
-23.9
-11.6 +1.4 +5.4
+36.5
Operating income gain ¥7.8 bn
(Exchange loss: ¥6.2 bn)
Gross profit down ¥34.1 bn
Sales down, product mix,
manufacturing fixed costs
Exchange loss Material
costs down
Exchange gain
(SG&A, R&D)
SG&A, R&D
down
(Billions of yen)