O'Reilly Auto Parts 2012 Annual Report Download - page 8
Download and view the complete annual report
Please find page 8 of the 2012 O'Reilly Auto Parts annual report below. You can navigate through the pages in the report by either clicking on the pages listed below, or by using the keyword search tool below to find specific information within the annual report.-
 1
1 -
 2
2 -
 3
3 -
 4
4 -
 5
5 -
 6
6 -
 7
7 -
 8
8 -
 9
9 -
 10
10 -
 11
11 -
 12
12 -
 13
13 -
 14
14 -
 15
15 -
 16
16 -
 17
17 -
 18
18 -
 19
19 -
20
-
21
-
22
-
23
-
24
-
25
-
26
-
27
-
28
-
29
-
30
-
31
-
32
-
33
-
34
-
35
-
36
-
37
-
38
-
39
-
40
-
41
-
42
-
43
-
44
-
45
-
46
-
47
-
48
-
49
-
50
-
51
-
52
-
53
-
54
-
55
-
56
-
57
-
58
-
59
-
60
-
61
-
62
-
63
-
64
-
65
-
66
-
67
-
68
-
69
-
70
-
71
-
72
-
73
-
74
-
75
-
76
-
77
-
78
-
79
-
80
-
81
-
82
-
83
-
84
-
85
-
86
-
87
-
88
-
89
-
90
-
91
-
92
-
93
-
94
-
95
 |
 |

6
O’REILLY AUTOMOTIVE 2012 ANNUAL REPORT
13
11
11
13
440
84
65
67
87
72
72
72
24
16
110
35
18
3
95
101
90
112
130
109
115
130
112
142
167
584
48
33
48
483
56
41
30
58
147
183
145
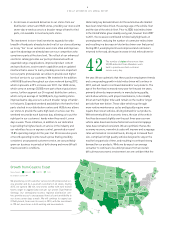
Distribution Centers •
Store Counts 200-600 100-199 1-99
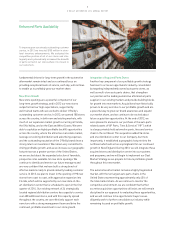
We provide top-notch customer service to both professional ser-
vice provider and do-it-yourself customers in 42 states. During
2012, we opened 180 net, new stores staffed with well trained
teams eager to aggressively execute our proven Dual Market
Strategy. Our strategically located, regional distribution cen-
ters provide access to unsurpassed levels of parts availability to
our stores seven days a week. We will continue to expand our
O’Reilly brand, from coast to coast, in 2013, with the investment
in 190 net, new stores in both existing and new markets.
Growth from Coast to Coast
• An increase in weekend deliveries to our stores from our
distribution centers and HUB stores, providing our stores with
seven-day-a-week access to a broader range of hard-to-find
parts, not available in most auto parts stores.
The investment in store-level inventories expands the wide
breadth of hard parts already stocked in all of our stores allowing
us to say “Yes” to our customers even more often and improves
upon the advantage we already have over our competitors who
carry fewer parts at the store level. The rollout of our enhanced
electronic catalog provides our parts professionals with an
expanded range of applications, improved product content
and specifications, easier search capabilities and an updated
interface that is easier to learn, providing one more important
tool our parts professionals can utilize to provide even higher
levels of service to our customers. We invested in the addition
of 48 HUB locations throughout our store network during 2012,
which represents a 25% increase over 2011. Our HUB stores,
which carry on average 20,000 more parts than a typical store
carries, further augment our 24 regional distribution centers,
which carry an average of 142,000 parts, by providing stores
improved same-day access to a much broader range of harder-
to-find parts. Expanded weekend availability to the hard-to-find
parts stocked in our distribution centers and HUB stores allows
our stores to provide the same high level of service over the
weekend we provide each business day, allowing us to put the
right part in our customers’ hands when they need it, seven
days a week. These initiatives, in addition to our dedication
to providing the highest levels of service in the industry and
our relentless focus on expense control, generated a record
15.8% operating margin for the year. Our 20 consecutive years
of record operating income results prove that by providing
consistent, unsurpassed customer service, we can profitably
grow our business in periods of both strong and more difficult
macroeconomic conditions.
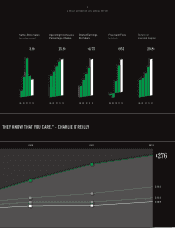
Historically, key demand drivers for the automotive aftermarket
have been total miles driven, the average age of the vehicle fleet
and the size of the vehicle fleet. Prior to 2008, total miles driven
in the United States grew steadily every year; however from 2007
to 2011, the recession contributed to historically high levels of
unemployment, reducing the number of commuter miles driven
and resulting in a decrease in total miles driven over that period.
During 2012, unemployment levels improved and commuters
returned to the road, driving an increase in total miles driven for
the year. We are optimistic that these positive employment trends
and corresponding growth in total miles driven will continue in
2013, and will result in continued demand for our products. The
age of the fleet has increased every year for the past ten years,
primarily driven by improvements in manufacturing quality,
which allow vehicles, with proper maintenance, to be reliably
driven at much higher miles and remain on the road for longer
periods than ever before. These older vehicles go through
more routine maintenance cycles and typically require more
repairs than newer vehicles, driving demand for our products.
With extremely difficult economic times, the size of the vehicle
fleet has decreased slightly over the past three years as new
vehicle sales have been below historical levels and scrappage
rates have remained consistent. We are optimistic that as the
economy recovers, new vehicle sales will improve and scrappage
rates will remain at consistent levels, driving an increased fleet
size, comprised of high quality vehicles designed to stay on the
road for long periods of time, and resulting in continued strong
demand for our products. While we do expect our average
consumer to continue to be under pressure from an overall
difficult macroeconomic environment, we are confident that the
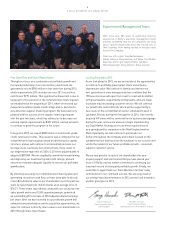
42The number of states where more than
53,000 dedicated Team Members work
hard to provide excellent customer
service every day.