O'Reilly Auto Parts 2012 Annual Report Download - page 18
Download and view the complete annual report
Please find page 18 of the 2012 O'Reilly Auto Parts annual report below. You can navigate through the pages in the report by either clicking on the pages listed below, or by using the keyword search tool below to find specific information within the annual report.-
 1
1 -
2
-
3
-
4
-
5
-
6
-
7
-
 8
8 -
 9
9 -
 10
10 -
 11
11 -
 12
12 -
 13
13 -
 14
14 -
 15
15 -
 16
16 -
 17
17 -
 18
18 -
 19
19 -
 20
20 -
 21
21 -
 22
22 -
 23
23 -
 24
24 -
 25
25 -
 26
26 -
 27
27 -
 28
28 -
29
-
30
-
31
-
32
-
33
-
34
-
35
-
36
-
37
-
38
-
39
-
40
-
41
-
42
-
43
-
44
-
45
-
46
-
47
-
48
-
49
-
50
-
51
-
52
-
53
-
54
-
55
-
56
-
57
-
58
-
59
-
60
-
61
-
62
-
63
-
64
-
65
-
66
-
67
-
68
-
69
-
70
-
71
-
72
-
73
-
74
-
75
-
76
-
77
-
78
-
79
-
80
-
81
-
82
-
83
-
84
-
85
-
86
-
87
-
88
-
89
-
90
-
91
-
92
-
93
-
94
-
95
 |
 |

FORM 10-k
8
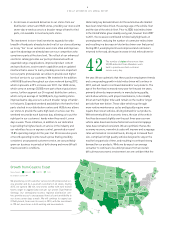
Louisiana 87 2.3% 3 1.3% 90 2.3% 74.3%
Wisconsin 78 2.1% 9 3.8% 87 2.2% 76.5%
Colorado 84 2.2% - 0.0% 84 2.1% 78.6%
Mississippi 71 1.9% 1 0.4% 72 1.8% 80.4%
Kansas 71 1.9% 1 0.4% 72 1.8% 82.2%
South Carolina 61 1.6% 11 4.7% 72 1.8% 84.0%
Iowa 66 1.8% 1 0.4% 67 1.7% 85.7%
Kentucky 62 1.7% 3 1.3% 65 1.6% 87.3%
Florida 46 1.2% 12 5.2% 58 1.5% 88.8%
Utah 55 1.5% 1 0.4% 56 1.4% 90.2%
N
evada 44 1.2% 4 1.7% 48 1.2% 91.4%
Oregon 44 1.2% 4 1.7% 48 1.2% 92.6%
N
ew Mexico 39 1.0% 2 0.8% 41 1.0% 93.6%
Virginia 25 0.7% 15 6.5% 40 1.0% 94.6%
Maine - 0.0% 35 14.9% 35 0.9% 95.5%
Idaho 30 0.8% 3 1.3% 33 0.8% 96.3%
N
ebraska 30 0.8% - 0.0% 30 0.8% 97.1%
Montana 23 0.6% 1 0.4% 24 0.6% 97.7%
N
ew Hampshire - 0.0% 18 7.6% 18 0.5% 98.2%
Wyoming 16 0.4% - 0.0% 16 0.4% 98.6%
N
orth Dakota 13 0.3% - 0.0% 13 0.3% 98.9%
Alaska 12 0.3% 1 0.4% 13 0.3% 99.2%
Hawaii 11 0.3% - 0.0% 11 0.3% 99.5%
South Dakota 11 0.3% - 0.0% 11 0.3% 99.8%
West Virginia 1 0.0% 3 1.3% 4 0.1% 99.9%
Massachusetts - 0.0% 3 1.3% 3 0.1% 100.0%
Total 3,740 100.0% 236 100.0% 3,976 100.0%
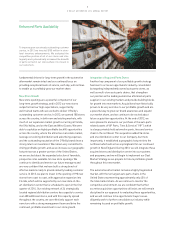
Store Layout:
We utilize a computer-assisted store layout system to provide a uniform and consistent retail merchandise presentation and customize
our hard-parts inventory assortment to meet the specific needs of a particular market area. Front room merchandise is arranged to
provide easy customer access, maximum selling space and to prominently display high-turnover products and accessories to
customers. To ensure the best customer experience possible, we have selectively implemented bilingual in-store signage based on the
demographics in each store’s geographic area. Aisle displays and end caps are used to feature high-demand, seasonal merchandise,
new items and advertised specials.
Store Automation:
To enhance store-level operations, customer service and reliability, we use Linux servers and IBM I-Series computer systems in our
stores. These systems are linked with the I-Series computers located in each of our DCs. Our point-of-sale system provides
immediate access to our electronic catalog, part images, schematics and pricing information by make, model and year of vehicle and
use barcode scanning technology to price our merchandise. This system speeds transaction times, reduces the customer’s checkout
time, ensures accuracy and provides enhanced customer service. Moreover, our store automation systems capture detailed sales
information which assists in store management, strategic planning, inventory control and distribution efficiency.
New Store Site Selection:
In selecting sites for new stores, we seek to strategically locate store sites in clusters within geographic areas in order to achieve
economies of scale in management, advertising and distribution. Other key factors we consider in the site selection process are
identified below:
• population density;
• demographics including age, ethnicity, life style and per capita income;
• market economic strength, retail draw and growth patterns;
• number, age and percent of makes and models of registered vehicles;
• the number, type and sales potential of existing automotive repair facilities;
• the number of auto parts stores and other competitors within a predetermined radius and the operational strength of such
competitors;
• physical location, traffic count, size, economics and presentation of the site;
• financial review of adjacent existing locations; and
•