Nikon 2014 Annual Report Download - page 8
Download and view the complete annual report
Please find page 8 of the 2014 Nikon annual report below. You can navigate through the pages in the report by either clicking on the pages listed below, or by using the keyword search tool below to find specific information within the annual report.-
 1
1 -
 2
2 -
 3
3 -
 4
4 -
 5
5 -
 6
6 -
 7
7 -
 8
8 -
 9
9 -
 10
10 -
 11
11 -
 12
12 -
 13
13 -
 14
14 -
 15
15 -
 16
16 -
 17
17 -
 18
18 -
 19
19 -
20
-
21
-
22
-
23
-
24
-
25
-
26
-
27
-
28
-
29
-
30
-
31
-
32
-
33
-
34
-
35
-
36
-
37
-
38
-
39
-
40
-
41
-
42
-
43
-
44
-
45
-
46
-
47
-
48
-
49
-
50
-
51
-
52
-
53
-
54
-
55
-
56
-
57
-
58
-
59
-
60
-
61
-
62
-
63
-
64
-
65
-
66
-
67
-
68
-
69
-
70
-
71
-
72
-
73
-
74
-
75
-
76
-
77
-
78
-
79
-
80
-
81
-
82
-
83
-
84
-
85
-
86
-
87
-
88
 |
 |

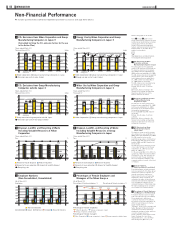
CO2 Emissions from Nikon Corporation and Group
Manufacturing Companies in Japan
(Calculated by fi xing the CO2 emission factors for the use
in the Action Plan)
(Years ended March 31)
Thousand tons of CO2 Index
1
Notes to the graph are as follows.
Notes 1 through 6 apply to seven
Group manufacturing companies in Japan
and two Group manufacturing companies
outside Japan. Refer to “The Nikon
Group’s Environmental Management
Systems and Environmental Performance
Data Boundary” on the Nikon Group
website for more details.
http://www.nikon.com/about/csr/envi-
ronment/promote/management/
1 CO2 Emissions from Nikon
Corporation and Group
Manufacturing Companies in Japan
The values above are the aggregated
results of CO2 emissions from energy use.
The baseline emissions are the average
value between the year ended March 31,
2006, and the year ended March 31, 2008.
The CO2 emission factors are the weighted
average values of the actual emission
factors between the year ended March
31, 2006, and the year ended March
31, 2008 (fi xed for all periods).
The CO2 emissions are calculated using
the following unit heating values:
City gas: Specifi c value of each gas
company
Other fuels: Values contained in the
Manual for Calculating and Reporting
Greenhouse Gas Emissions for the
baseline emission calculation
2 Energy Use by Nikon Corporation
and Group Manufacturing
Companies in Japan
The baseline use is the average value
between the year ended March 31, 2006,
and the year ended March 31, 2008.
The energy use is calculated using the
following unit heating values:
Electricity: 0.00976 GJ/kWh (fi xed for
all periods)
City gas: Specifi c value of each gas
company
Other fuels: Values contained in the
Manual for Calculating and Reporting
Greenhouse Gas Emissions for the use
calculation of each year
3 CO2 Emissions from Group
Manufacturing Companies
outside Japan
The baseline emissions are the average
value between the year ended March 31,
2006, and the year ended March 31, 2008.
The CO2 emission factors are the
weighted average values of International
Energy Agency (IEA) factors by country
between 2005 and 2007 (fi xed for the
whole period).
The baseline year for emissions per unit
of real output (index) is set at the year
ended March 31, 2007 (year ended
March 31, 2007 = 1).
For the year ended March 31, 2012, the
calculation of CO2 emissions from Nikon
(Thailand) Co., Ltd., was limited to the
period from April through September
due to the temporary shutdown of the
company’s plants as a result of the fl ood
in Thailand.
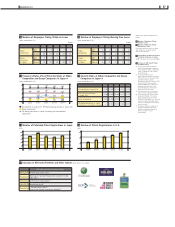
7 Employee Numbers
(Non-Consolidated, Consolidated)
Consolidated fi gures include permanent
and non-regular staff of the Nikon Group
and directors of Group companies. For
regional percentages, employees of
Nikon Corporation who are temporarily
dispatched to Group companies are
included in the region to which they are
assigned, while employees dispatched to
non-consolidated companies are not
included. Employees of Nikon Metrology
NV and its subsidiary Group companies
are included in the European fi gures.
8 Percentages of Female Employees
and Managers at the Nikon Group
Permanent employees and non-regular
staff in the Nikon Group (consolidated):
Those dispatched to affi liates are
counted as employees of the affi liates.
The fi gures for the year ended March 31,
2013, include the fi gures for the two
equity-method affi liates.
“Managers” means section managers and
higher. Managers of Nikon Corporation
include those in positions other than
department manager or higher and those
in section manager positions.
Group companies outside Japan include
Nikon (Thailand) Co., Ltd., Nikon
Imaging (China) Co., Ltd., and Hikari
Glass (Changzhou) Optics Co., Ltd.
Percentage of female employees
Nikon Corporation Group companies in Japan
Group companies outside Japan
Percentage of female managers
■
■ Nikon Corporation
■
■ Group companies in Japan
■
■
Group companies outside Japan
62.6
63.2
65.9
69.2
73.5
16.9
16.9
16.8
17.0
17.0
25.2
24.5
24.9
25.1
19.4
10.0
9.7
9.4
9.2
8.8
3.63.12.52.31.8 2.9
3.13.1
2.32.30.80.81.71.7
2011
2010 2012 2013 2014
80
40
60
20
0
40
30
20
10
0
Percentages of Female Employees and
Managers at the Nikon Group
(As of March 31)
Percentage of female employees: % Percentage of female managers: %
8
■
■ Nikon Corporation
■
■ Group manufacturing companies in Japan
Energy use per unit of sales (Index)
1,372
3,357
1,180 1,112 1,095 1,037
1,985 1,964 1,863 1,915 1,886
1.00 0.87 0.81 0.76 0.78
3,144 3,011 2,923
2,974
4,000
2,000
3,000
1,000
0
1.00
0.75
0.50
0.25
0
2011 2012 2013 2014
Baseline
energy use
Energy Use by Nikon Corporation and Group
Manufacturing Companies in Japan
(Years ended March 31)
TJ Index
2
■
■ Amount of waste disposal
■
■ Amount recycled
■
■
Amount of mass reduction
■
■ Amount of landfi ll disposal
Recycling rate
3,022
10 3
99.6
3,035
4,000
2,000
3,000
1,000
0
100
75
50
25
0
2010 2011 2012 2013 2014
Disposal, Landfi ll, and Recycling of Waste
Including Valuable Resources at Nikon
Corporation
(Years ended March 31)
Tons %
5
■
■ Amount of waste disposal
■
■ Amount recycled
■
■
Amount of mass reduction
■
■ Amount of landfi ll disposal
Recycling rate
2,326
76 55
94.7
2,457
4,000
2,000
3,000
1,000
0
100
75
50
25
0
2010 2011 2012 2013 2014
Disposal, Landfi ll, and Recycling of Waste
Including Valuable Resources at Group
Manufacturing Companies in Japan
(Years ended March 31)
Tons %
6
■
■
Non-consolidated
Consolidated
■
■
Japan
■
■
Americas
■
■
Europe
■
■
Asia and Oceania
42.6%
5.3%
7.1%
44.9%
5,315 5,306 5,397 5,583 5,684
26,125 24,409 24,348 24,047 23,859
2011
2010 2012 2013 2014
30,000
15,000
25,000
10,000
20,000
5,000
0
Employee Numbers
(Non-Consolidated, Consolidated)
(As of March 31)
Employees
7
■
■ Nikon Corporation
■
■ Group manufacturing companies in Japan
Emissions per unit of sales (Index)
65
146
54 51 50 47
80 80 76 78 77
1.00 0.85 0.80 0.74 0.77
134 128 124
127
2011
Baseline
emissions 2012 2013 2014
150
120
60
90
30
0
1.5
1.2
0.9
0.6
0.3
0
INTRODUCTION
■
■ Group manufacturing companies outside Japan
Emissions per unit of real output (Index)
1.00 1.00
0.91 0.85 0.92
54 76 57 60 61
Baseline
emissions
100
80
40
60
20
0
1.5
1.2
0.9
0.6
0.3
0
2011 2012 2013 2014
CO2 Emissions from Group Manufacturing
Companies outside Japan
(Years ended March 31)
Thousand tons of CO2 Index
3
■
■ Nikon Corporation
■
■ Group manufacturing companies in Japan
848
2,497
833 899 919 902
1,649
1,937 2,126 2,013 1,917
2,770 2,932 2,819
3,026
2010
4,000
2,000
3,000
1,000
02011 2012 2013 2014
Water Use by Nikon Corporation and Group
Manufacturing Companies in Japan
(Years ended March 31)
Thousand m3
4
Non-Financial Performance
: Includes quantitative data covered by independent practitioner’s assurance. (See page 85 for details.)
06 NIKON REPORT 2014