Nikon 2014 Annual Report Download - page 17
Download and view the complete annual report
Please find page 17 of the 2014 Nikon annual report below. You can navigate through the pages in the report by either clicking on the pages listed below, or by using the keyword search tool below to find specific information within the annual report.-
 1
1 -
2
-
3
-
4
-
5
-
6
-
 7
7 -
 8
8 -
 9
9 -
 10
10 -
 11
11 -
 12
12 -
 13
13 -
 14
14 -
 15
15 -
 16
16 -
 17
17 -
 18
18 -
 19
19 -
 20
20 -
 21
21 -
 22
22 -
 23
23 -
 24
24 -
 25
25 -
 26
26 -
 27
27 -
28
-
29
-
30
-
31
-
32
-
33
-
34
-
35
-
36
-
37
-
38
-
39
-
40
-
41
-
42
-
43
-
44
-
45
-
46
-
47
-
48
-
49
-
50
-
51
-
52
-
53
-
54
-
55
-
56
-
57
-
58
-
59
-
60
-
61
-
62
-
63
-
64
-
65
-
66
-
67
-
68
-
69
-
70
-
71
-
72
-
73
-
74
-
75
-
76
-
77
-
78
-
79
-
80
-
81
-
82
-
83
-
84
-
85
-
86
-
87
-
88
 |
 |

Strengthen business fundamentals Growth drivers
Priority Measures
Foster new businesses and strengthen existing businesses
Profi tability
Growth potential
Microscope Solutions Business /
Industrial Metrology Business
• Aim for business with net sales on
the scale of ¥100 billion
• Switch emphasis mainly from
hardware to solutions
• Aggressively pursue M&A and
alliances
M&A Program
• Spend ¥200 billion in M&A funds on the Medical and
Instruments businesses
• Launch corporate venture capital on the scale of ¥30 billion for
the Medical Business and encourage open innovation
R&D Program
• Of ¥220 billion R&D budget (March 2015 fi scal year to March
2017 fi scal year), invest ¥50 billion in the Medical Business
and new business domains
• Generate synergies among technologies, setting the Core
Technology Division as a hub
• Cultivate venture companies
Human Resources Program
• Enable the interdivisional fl ow of personnel
• Hire experienced experts
• Reform the mind-set among all employees and cultivate the next
generation of leaders
Cost Reduction Program
• Reduce costs in design and manufacturing processes
• Reduce overhead at headquarters and in business units
• Fundamentally review production regime to refl ect the rebuilding
of the business portfolio
Four Programs to Achieve Transformation
FPD
Lithography
Business
Imaging Products
Business
Medical
Business
Maintain
profi tability
Solidify
profi tability
Improve
profi tability New growth
drivers
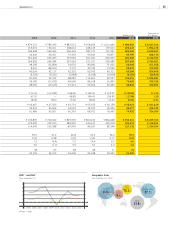
Management Numerical Targets
Foreign Exchanges Assumptions (Yen)
Years ended / ending March 31
2014
(result) 2015
(forecast) 2016
(forecast) 2017
(forecast)
US$ 100.17 101 100 100
Euro 134.21 136 140 140
Net Sales / Operating Income / Operating Margin
(Years ended / ending March 31)
Billions of yen %
R&D Expenses
Cumulative for March 2015 fi scal year
to March 2017 fi scal year
¥220 billion
Of which, ¥50 billion to be invested in Medical
Business and new businesses
Capital Expenditures
Cumulative for March 2015 fi scal year
to March 2017 fi scal year
¥110 billion
■
■ Net sales (left scale)
■
■ Operating income (left scale)
—
Operating margin (right scale)
* Figures for the fi scal year ending March 2015 are as of August 7, 2014; fi gures for the fi scal year
ending March 2016 and the fi scal year ending March 2017 are as of the announcement of the
Medium-Term Management Plan on June 17, 2014.
62.9 53.0 90.0 110.0
9.2
8.6
5.9
6.4
980.6 900.0
1,050.0
1,200.0
2014
(result)
2015
(target)
2016
(target)
2017
(target)
2,000
1,200
1,600
800
400
0
10
8
6
4
2
0
Microscope
Solutions
Business
Industrial
Metrology
Business
Concentrated shift
of management
resources from
existing businesses
Medical Business
• Aim for business with net sales on
the scale of ¥200 billion
• Redirect internal and external
management resources to Medical
Business
• Aggressively pursue M&A and
alliances
Semiconductor
Lithography
Business
15
NIKON REPORT 2014