Nikon 2014 Annual Report Download - page 6
Download and view the complete annual report
Please find page 6 of the 2014 Nikon annual report below. You can navigate through the pages in the report by either clicking on the pages listed below, or by using the keyword search tool below to find specific information within the annual report.-
 1
1 -
 2
2 -
 3
3 -
 4
4 -
 5
5 -
 6
6 -
 7
7 -
 8
8 -
 9
9 -
 10
10 -
 11
11 -
 12
12 -
 13
13 -
 14
14 -
 15
15 -
 16
16 -
 17
17 -
18
-
19
-
20
-
21
-
22
-
23
-
24
-
25
-
26
-
27
-
28
-
29
-
30
-
31
-
32
-
33
-
34
-
35
-
36
-
37
-
38
-
39
-
40
-
41
-
42
-
43
-
44
-
45
-
46
-
47
-
48
-
49
-
50
-
51
-
52
-
53
-
54
-
55
-
56
-
57
-
58
-
59
-
60
-
61
-
62
-
63
-
64
-
65
-
66
-
67
-
68
-
69
-
70
-
71
-
72
-
73
-
74
-
75
-
76
-
77
-
78
-
79
-
80
-
81
-
82
-
83
-
84
-
85
-
86
-
87
-
88
 |
 |

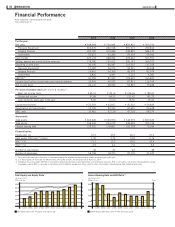
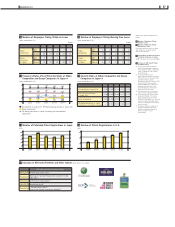
Financial Performance
Nikon Corporation and Consolidated Subsidiaries
Years ended March 31
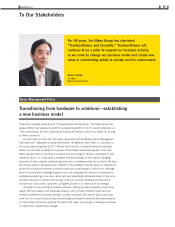
INTRODUCTION
2005 2006 2007 2008
For the year:
Net sales ¥ 638,468 ¥ 730,944 ¥ 822,813 ¥ 955,792
Precision Equipment 212,470 242,318 291,913 290,814
Imaging Products 354,181 415,686 448,825 586,147
Instruments 50,657 53,280 59,252 59,043
Cost of sales 429,143 468,944 494,663 551,551
Selling, general and administrative expenses 178,780 195,413 226,143 269,072
Operating income (loss) 30,545 66,587 102,007 135,169
Precision Equipment 11,387 26,375 49,321 43,348
Imaging Products 16,841 34,369 45,678 83,974
Instruments 2,826 4,085 5,123 4,081
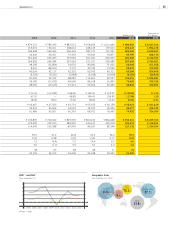
EBITDA*350,250 87,347 124,632 160,847
Income (loss) before income taxes and minority interests 33,443 40,925 87,813 116,704
Net income (loss) 24,141 28,945 54,825 75,484
Per share of common stock (yen and U.S. dollars)*1:
Basic net income (loss) ¥ 65.19 ¥ 78.16 ¥ 146.36 ¥ 189.00
Diluted net income 57.84 69.33 131.42 181.23
Cash dividends applicable to the year 8.00 10.00 18.00 25.00
Capital expenditures ¥ 22,459 ¥ 25,817 ¥ 30,432 ¥ 39,829
Depreciation and amortization 19,705 20,760 22,625 25,678
R&D costs 33,561 37,139 47,218 58,373
At year-end:
Total assets ¥ 633,426 ¥ 690,920 ¥ 748,939 ¥ 820,622
Total equity 196,030 243,122 348,445 393,126
Interest-bearing debt 195,351 178,841 105,338 76,544
Financial ratios:
Equity ratio (%) 30.9 35.2 46.5 47.9
Debt equity (D/E) ratio*3 (times) 1.00 0.74 0.30 0.19
ROE*3 (%) 13.1 13.2 18.5 20.4
ROA*3 (%) 3.9 4.4 7.6 9.6
Number of subsidiaries 46 47 49 48
Number of employees 16,758 18,725 22,705 25,342
*1. Per share of common stock information is computed based on the weighted average number of shares outstanding during the year.
*2. U.S. dollar fi gures are translated for reference only at ¥102.92 to US$1, the exchange rate at March 31, 2014.
*3. Throughout this annual report, EBITDA is calculated as operating income (loss) plus depreciation and amortization expenses, ROE is calculated as net income (loss) divided by average
shareholders’ equity, ROA is calculated as net income (loss) divided by average total assets, and D/E ratio is calculated as interest-bearing debt divided by total equity.
Total Equity and Equity Ratio
(As of March 31)
Millions of yen %
Interest-Bearing Debt and D/E Ratio*3
(As of March 31)
Millions of yen Times
Total equity (left scale) Equity ratio (right scale) Interest-bearing debt (left scale) D/E ratio (right scale)
2005 2006 2007 2008 2009 2010 2011 2012 2013 2014
600,000
500,000
400,000
300,000
200,000
100,000
0
60
50
40
30
20
10
02005 2006 2007 2008 2009 2010 2011 2012 2013 2014
200,000
150,000
100,000
50,000
0
1.2
0.9
0.6
0.3
0
04 NIKON REPORT 2014