Navy Federal Credit Union 2005 Annual Report Download - page 35
Download and view the complete annual report
Please find page 35 of the 2005 Navy Federal Credit Union annual report below. You can navigate through the pages in the report by either clicking on the pages listed below, or by using the keyword search tool below to find specific information within the annual report.-
 1
1 -
2
-
3
-
4
-
5
-
6
-
7
-
8
-
9
-
10
-
11
-
12
-
13
-
14
-
15
-
16
-
17
-
18
-
19
-
20
-
21
-
22
-
23
-
24
-
 25
25 -
 26
26 -
 27
27 -
 28
28 -
 29
29 -
 30
30 -
 31
31 -
 32
32 -
 33
33 -
 34
34 -
 35
35 -
 36
36 -
 37
37 -
 38
38 -
 39
39 -
 40
40 -
 41
41 -
 42
42 -
 43
43 -
 44
44 -
 45
45 -
46
-
47
-
48
-
49
 |
 |

5
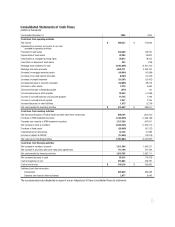
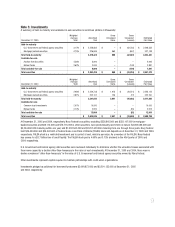
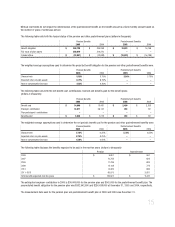
Consolidated Statements of Cash Flows
(dollars in thousands)
The accompanying notes (beginning on page 6) are an integral part of these consolidated financial statements.
Years Ended December 31 2005 2004
Cash flows from operating activities
Net income $ 266,337 $ 273,836
Adjustments to reconcile net income to net cash
provided by operating activities:
Provision for loan losses 244,369 149,750
Depreciation of fixed assets 42,395 35,802
Amortization of mortgage servicing rights 20,672 19,033
Loss/(Gain) on disposal of fixed assets 353 (759)
Mortgage loans originated for sale (4,363,626) (4,451,241)
Mortgage loan sales proceeds 4,442,771 4,345,233
(Increase) in mortgage servicing assets (49,954) (41,884)
(Increase) in accrued interest receivable (8,207) (10,332)
(Increase) in prepaid expenses (19,201) (23,402)
(Increase)/decrease in accounts receivable (50,099) 89,279
Decrease in other assets 2,270 3,694
(Decrease)/increase in dividends payable (674) 120
Increase/(decrease) in drafts payable 29,442 (11,669)
Increase in accrued expenses and accounts payable 14,724 7,249
Increase in accrued interest payable 2,347 2,236
Increase/(decrease) in other liabilities 1,573 (2,274)
Net cash provided by operating activities $ 575,492 $ 384,671
Cash flows from investing activities
Net Decrease/(increase) in Federal funds and other short-term investments 856,164 (502,301)
Purchase of HTM investment securities (1,388,549) (1,568,184)
Proceeds from maturity of HTM investment securities 1,137,280 647,917
Net increase in loans to members (2,444,345) (1,550,277)
Purchase of fixed assets (95,045) (81,232)
Sale/retirement of fixed assets 32,136 31,999
Increase in deposit to NCUSIF (13,504) (20,919)
Net cash used in investing activities (1,915,863) (3,042,997)
Cash flows from financing activities
Net increase in members’ accounts 1,321,506 1,840,227
Net increase in securities sold under repurchase agreements 112,199 747,484
Net cash provided by financing activities 1,433,705 2,587,711
Net increase/(decrease) in cash 93,334 (70,615)
Cash at beginning of year 255,882 326,497
Cash at end of year $ 349,216 $ 255,882
Additional cash flow information:
Interest paid 505,040 395,099
Transfers from loans to other real estate 2,977 6,443