National Grid 2016 Annual Report Download - page 81
Download and view the complete annual report
Please find page 81 of the 2016 National Grid annual report below. You can navigate through the pages in the report by either clicking on the pages listed below, or by using the keyword search tool below to find specific information within the annual report.-
 1
1 -
2
-
3
-
4
-
5
-
6
-
7
-
8
-
9
-
10
-
11
-
12
-
13
-
14
-
15
-
16
-
17
-
18
-
19
-
20
-
21
-
22
-
23
-
24
-
25
-
26
-
27
-
28
-
29
-
30
-
31
-
32
-
33
-
34
-
35
-
36
-
37
-
38
-
39
-
40
-
41
-
42
-
43
-
44
-
45
-
46
-
47
-
48
-
49
-
50
-
51
-
52
-
53
-
54
-
55
-
56
-
57
-
58
-
59
-
60
-
61
-
62
-
63
-
64
-
65
-
66
-
67
-
68
-
69
-
70
-
 71
71 -
 72
72 -
 73
73 -
 74
74 -
 75
75 -
 76
76 -
 77
77 -
 78
78 -
 79
79 -
 80
80 -
 81
81 -
 82
82 -
 83
83 -
 84
84 -
 85
85 -
 86
86 -
 87
87 -
 88
88 -
 89
89 -
 90
90 -
 91
91 -
92
-
93
-
94
-
95
-
96
-
97
-
98
-
99
-
100
-
101
-
102
-
103
-
104
-
105
-
106
-
107
-
108
-
109
-
110
-
111
-
112
-
113
-
114
-
115
-
116
-
117
-
118
-
119
-
120
-
121
-
122
-
123
-
124
-
125
-
126
-
127
-
128
-
129
-
130
-
131
-
132
-
133
-
134
-
135
-
136
-
137
-
138
-
139
-
140
-
141
-
142
-
143
-
144
-
145
-
146
-
147
-
148
-
149
-
150
-
151
-
152
-
153
-
154
-
155
-
156
-
157
-
158
-
159
-
160
-
161
-
162
-
163
-
164
-
165
-
166
-
167
-
168
-
169
-
170
-
171
-
172
-
173
-
174
-
175
-
176
-
177
-
178
-
179
-
180
-
181
-
182
-
183
-
184
-
185
-
186
-
187
-
188
-
189
-
190
-
191
-
192
-
193
-
194
-
195
-
196
-
197
-
198
-
199
-
200
-
201
-
202
-
203
-
204
-
205
-
206
-
207
-
208
-
209
-
210
-
211
-
212
 |
 |

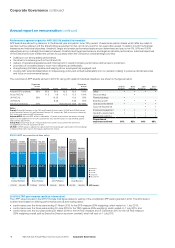
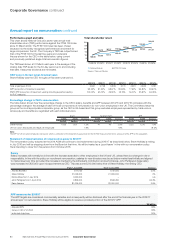
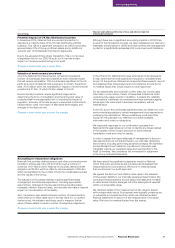
2014/15 £m
2015/16 £m
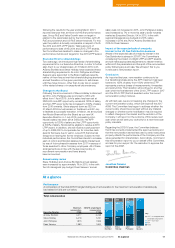
1,459 1,506 1,611 1,622
695
+8.3%
-1.9%
+0.7%
+3.2%
753
1,033 1,013
Payroll costs Dividends Tax Net interest
Capital expenditure
+12.2%
3,470
3,893
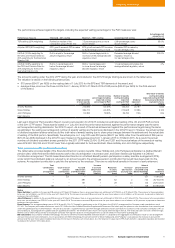
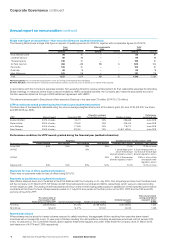
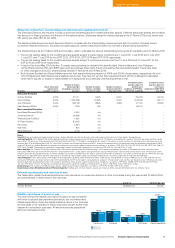
Statement of Directors’ shareholdings and share interests (audited information)
The Executive Directors are required to build up and hold a shareholding from vested share plan awards. Deferred share plan awards are not taken
into account for these purposes until the end of the deferral period. Shares are valued for these purposes at the 31 March 2016 price, which was
987 pence per share ($71.42 per ADS).
The following table shows how each Executive Director complies with the shareholding requirement and also the number of shares owned
by the Non-executive Directors, including connected persons, as Non-executive Directors do not have a shareholding requirement.
The shareholding is as at 31 March 2016 and the salary used to calculate the value of shareholding is the gross annual salary as at 31 March 2016:
• The normal vesting dates for the conditional share awards subject to performance conditions are 1 July 2016; 1 July 2016 and 1 July 2017;
1 July 2017; and 1 July 2018 for the LTPP 2012, LTPP 2013, LTPP 2014 and LTPP 2015 respectively.
• The normal vesting dates for the conditional share awards subject to continuous employment are 13 June 2016 and 17 June 2017 for the
DSP 2013 and DSP 2014 respectively.
• In each of April and May 2016 a further 15 shares were purchased on behalf of Andrew Bonfield, Steve Holliday and John Pettigrew
via the Share Incentive Plan (an HMRC approved all-employee share plan), thereby increasing their beneficial interests. There have been
no other changes in Directors’ shareholdings between 1 April 2016 and 18 May 2016.
• Both Andrew Bonfield and Steve Holliday have met their shareholding requirement of 400% and 500% of base salary, respectively. As both
John Pettigrew and Dean Seavers were relatively new in post, they have not yet met their requirements and will not be allowed to sell shares
other than to pay tax on receipt of vested shares or in exceptional circumstances until this requirement is met.
Directors
Share ownership
requirements
(multiple of salary)
Number of shares
owned outright
(including connected
persons)
Number of shares
held as a multiple
of current salary
Number of options
granted under the
Sharesave Plan
Conditional share
awards subject to
performance
conditions (LTPP 2012,
2013, 2014 and 2015)
Conditional share
awards subject to
continuous
employment (DSP 2013
and 2014)
Executive Directors
Andrew Bonfield 400% 317,711 426% 6,651 756,209 92,754
Steve Holliday 500% 1,306,289 1,246% 3,542 1,224,546 126,771
John Pettigrew 400% 19 8,749 386% 4,286 417, 251 28,691
Dean Seavers (ADSs) 400% 1,225 9% –85,767 –
Non-executive Directors
Nora Mead Brownell (ADSs) –5,000 n/a –––
Jonathan Dawson –36,586 n/a –––
Therese Esperdy (ADSs) –1,600 n/a –––
Sir Peter Gershon –83,363 n/a –––
Paul Golby –2,500 n/a –––
Ruth Kelly –800 n/a –––
Mark Williamson –4,726 n/a –––
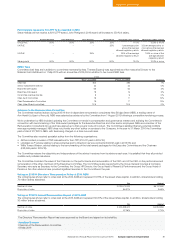
Notes:
Overall: Sharesave options are valued using fair values. Andrew Bonfield was the only Director who made a gain on the exercise of share options during the year.
Andrew Bonfield: On 31 March 2016 Andrew Bonfield held 6,651 options granted under the Sharesave plan. 2,022 options were granted at a value of 749 pence per share and they can be
exercised at 749 pence per share between April 2020 and September 2020. 1,208 options were granted at a value of 745 pence per share and they can be exercised at 745 pence per share
between April 2019 and September 2019. On 1 April 2016, he exercised a Sharesave option over 3,421 shares at the option price of 455 pence per share for expiration in September 2016 at
a gain of £18,549. For Andrew Bonfield, the number of conditional share awards subject to performance conditions is as follows: LTPP 2012: 53,273; LTPP 2013: 194,798; LTPP 2014: 248,470;
LTPP 2015: 259,668. The number of conditional share awards subject to continuous employment is as follows: DSP 2013: 45,706; DSP 2014: 47,048.
Steve Holliday: On 31 March 2016 Steve Holliday held 3,524 options granted under the Sharesave plan. 1,502 options were granted at a value of 599 pence per share, and they can be
exercised at 599 pence per share between April 2017 and September 2017. 2,022 options were granted at a value of 749 pence per share and they can be exercised at 749 pence per share
between April 2020 and September 2020. For Steve Holliday, the number of conditional share awards subject to performance conditions is as follows: LTPP 2012: 84,175; LTPP 2013: 307,793;
LTPP 2014: 407,138; LTPP 2015: 425,440. The number of conditional share awards subject to continuous employment is as follows: DSP 2013: 57,118; DSP 2014: 69,653.
John Pettigrew: On 31 March 2016 John Pettigrew held 4,286 options granted under the Sharesave plan. 1,252 options were granted at a value of 599 pence per share, and they can be
exercised at 599 pence per share between April 2019 and September 2019. 3,034 options were granted at a value of 749 pence per share and they can be exercised at 749 pence per share
between April 2020 and September 2020. The number of conditional share awards subject to performance conditions is as follows: LTPP 2012: 13,098; LTPP 2013: 63,361; LTPP 2014:
161,720; LTPP 2015: 179,072. The number of conditional share awards subject to continuous employment is as follows: DSP 2013: 14,341; DSP 2014: 14,350.
Dean Seavers: The number of conditional share awards subject to performance conditions is as follows: LTPP 2014: 40,966; LTPP 2015: 44,801.
Dean Seavers, Nora Mead Brownell and Therese Esperdy: Holdings and, for Dean Seavers, awards are shown as ADSs and each ADS represents five ordinary shares.
External appointments and retention of fees
The table below details the Executive Directors who served as non-executive directors in other companies during the year ended 31 March 2016
and were allowed to retain fees for their services:
Company Retained fees (£)
Andrew Bonfield Kingfisher plc 82,400
Relative importance of spend on pay
This chart shows the relative importance of spend on pay compared
with other costs and disbursements (dividends, tax, net interest and
capital expenditure). Given the capital-intensive nature of our business
and the scale of our operations, these costs were chosen as the most
relevant for comparison purposes. All amounts exclude exceptional
items and remeasurements.
79National Grid Annual Report and Accounts 2015/16
Corporate Governance
Annual report on remuneration