National Grid 2016 Annual Report Download - page 133
Download and view the complete annual report
Please find page 133 of the 2016 National Grid annual report below. You can navigate through the pages in the report by either clicking on the pages listed below, or by using the keyword search tool below to find specific information within the annual report.-
 1
1 -
2
-
3
-
4
-
5
-
6
-
7
-
8
-
9
-
10
-
11
-
12
-
13
-
14
-
15
-
16
-
17
-
18
-
19
-
20
-
21
-
22
-
23
-
24
-
25
-
26
-
27
-
28
-
29
-
30
-
31
-
32
-
33
-
34
-
35
-
36
-
37
-
38
-
39
-
40
-
41
-
42
-
43
-
44
-
45
-
46
-
47
-
48
-
49
-
50
-
51
-
52
-
53
-
54
-
55
-
56
-
57
-
58
-
59
-
60
-
61
-
62
-
63
-
64
-
65
-
66
-
67
-
68
-
69
-
70
-
71
-
72
-
73
-
74
-
75
-
76
-
77
-
78
-
79
-
80
-
81
-
82
-
83
-
84
-
85
-
86
-
87
-
88
-
89
-
90
-
91
-
92
-
93
-
94
-
95
-
96
-
97
-
98
-
99
-
100
-
101
-
102
-
103
-
104
-
105
-
106
-
107
-
108
-
109
-
110
-
111
-
112
-
113
-
114
-
115
-
116
-
117
-
118
-
119
-
120
-
121
-
122
-
 123
123 -
 124
124 -
 125
125 -
 126
126 -
 127
127 -
 128
128 -
 129
129 -
 130
130 -
 131
131 -
 132
132 -
 133
133 -
 134
134 -
 135
135 -
 136
136 -
 137
137 -
 138
138 -
 139
139 -
 140
140 -
 141
141 -
 142
142 -
 143
143 -
144
-
145
-
146
-
147
-
148
-
149
-
150
-
151
-
152
-
153
-
154
-
155
-
156
-
157
-
158
-
159
-
160
-
161
-
162
-
163
-
164
-
165
-
166
-
167
-
168
-
169
-
170
-
171
-
172
-
173
-
174
-
175
-
176
-
177
-
178
-
179
-
180
-
181
-
182
-
183
-
184
-
185
-
186
-
187
-
188
-
189
-
190
-
191
-
192
-
193
-
194
-
195
-
196
-
197
-
198
-
199
-
200
-
201
-
202
-
203
-
204
-
205
-
206
-
207
-
208
-
209
-
210
-
211
-
212
 |
 |

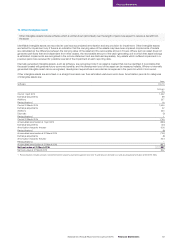
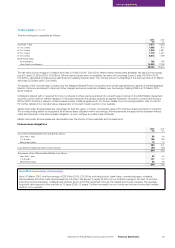
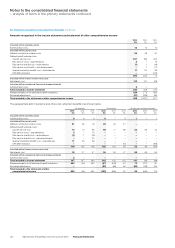
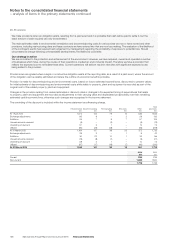
19. Borrowings continued
Total borrowings are repayable as follows:
2016
£m
2015
£m
Less than 1 year 3,611 3,028
In 1 to 2 years 1,835 873
In 2 to 3 years 1,816 1,601
In 3 to 4 years 1,775 1,437
In 4 to 5 years 2,276 1,709
More than 5 years:
by instalments 742 154
other than by instalments 16,289 17,10 8
28,344 25,910
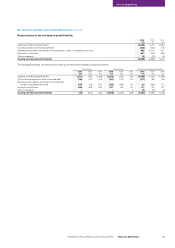
The fair value of borrowings at 31 March 2016 was £31,463m (2015: £30,103m). Where market values were available, fair value of borrowings
(Level 1) was £13,283m (2015: £14,583m). Where market values were not available, fair value of borrowings (Level 2) was £18,180m (2015:
£15,520m), calculated by discounting cash flows at prevailing interest rates. The notional amount outstanding of the debt portfolio at 31 March
2016 was £27,836m (2015: £25,419m).
The assets of the Colonial Gas Company and the Niagara Mohawk Power Corporation and certain gas distribution assets of the Narragansett
Electric Company are subject to liens and other charges and are provided as collateral over borrowings totalling £385m at 31 March 2016
(2015: £424m).
Collateral is placed with or received from any counterparty where we have entered into a credit support annex to the ISDA Master Agreement
once the current mark-to-market valuation of the trades between the parties exceeds an agreed threshold. Included in current bank loans is
£610m (2015: £540m) in respect of cash received under collateral agreements. For further details of our borrowing facilities, refer to note 31.
For further details of our bonds in issue, please refer to the debt investor section of our website.
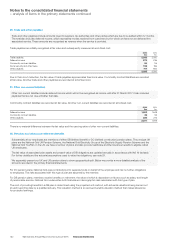
Assets held under finance leases are recognised at their fair value or, if lower, the present value of the minimum lease payments on inception.
The corresponding liability is recognised as a finance lease obligation within borrowings. Rental payments are apportioned between finance
costs and reduction in the finance lease obligation, so as to achieve a constant rate of interest.
Assets held under finance leases are depreciated over the shorter of their useful life and the lease term.
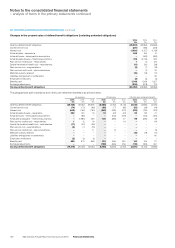
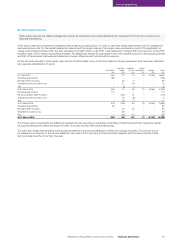
Finance lease obligations
2016
£m
2015
£m
Gross finance lease liabilities are repayable as follows:
Less than 1 year 53 44
1 to 5 years 156 125
More than 5 years 75 72
284 241
Less: finance charges allocated to future periods (41) (38)
243 203
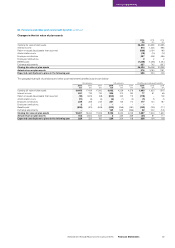
The present value of finance lease liabilities is as follows:
Less than 1 year 53 44
1 to 5 years 137 110
More than 5 years 53 49
243 203
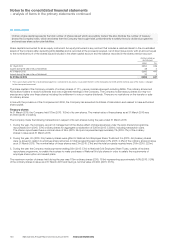
Unaudited commentary on borrowings
As at 31 March 2016, total borrowings of £28,344m (2015: £25,910m) including bonds, bank loans, commercial paper, collateral,
financeleases and other debt had increased by £2,434m. We expect to repay £3,611m of our total borrowings in the next 12 months
including commercial paper, collateral and interest, and to fund this repayment through the capital and money markets. The average
long-term debt maturity of the portfolio is 12 years (2015: 13 years). Further information on our bonds can be found in the debt investor
section of our website.
Financial Statements
131National Grid Annual Report and Accounts 2015/16 Financial Statements