National Grid 2016 Annual Report Download - page 101
Download and view the complete annual report
Please find page 101 of the 2016 National Grid annual report below. You can navigate through the pages in the report by either clicking on the pages listed below, or by using the keyword search tool below to find specific information within the annual report.-
 1
1 -
2
-
3
-
4
-
5
-
6
-
7
-
8
-
9
-
10
-
11
-
12
-
13
-
14
-
15
-
16
-
17
-
18
-
19
-
20
-
21
-
22
-
23
-
24
-
25
-
26
-
27
-
28
-
29
-
30
-
31
-
32
-
33
-
34
-
35
-
36
-
37
-
38
-
39
-
40
-
41
-
42
-
43
-
44
-
45
-
46
-
47
-
48
-
49
-
50
-
51
-
52
-
53
-
54
-
55
-
56
-
57
-
58
-
59
-
60
-
61
-
62
-
63
-
64
-
65
-
66
-
67
-
68
-
69
-
70
-
71
-
72
-
73
-
74
-
75
-
76
-
77
-
78
-
79
-
80
-
81
-
82
-
83
-
84
-
85
-
86
-
87
-
88
-
89
-
90
-
 91
91 -
 92
92 -
 93
93 -
 94
94 -
 95
95 -
 96
96 -
 97
97 -
 98
98 -
 99
99 -
 100
100 -
 101
101 -
 102
102 -
 103
103 -
 104
104 -
 105
105 -
 106
106 -
 107
107 -
 108
108 -
 109
109 -
 110
110 -
 111
111 -
112
-
113
-
114
-
115
-
116
-
117
-
118
-
119
-
120
-
121
-
122
-
123
-
124
-
125
-
126
-
127
-
128
-
129
-
130
-
131
-
132
-
133
-
134
-
135
-
136
-
137
-
138
-
139
-
140
-
141
-
142
-
143
-
144
-
145
-
146
-
147
-
148
-
149
-
150
-
151
-
152
-
153
-
154
-
155
-
156
-
157
-
158
-
159
-
160
-
161
-
162
-
163
-
164
-
165
-
166
-
167
-
168
-
169
-
170
-
171
-
172
-
173
-
174
-
175
-
176
-
177
-
178
-
179
-
180
-
181
-
182
-
183
-
184
-
185
-
186
-
187
-
188
-
189
-
190
-
191
-
192
-
193
-
194
-
195
-
196
-
197
-
198
-
199
-
200
-
201
-
202
-
203
-
204
-
205
-
206
-
207
-
208
-
209
-
210
-
211
-
212
 |
 |

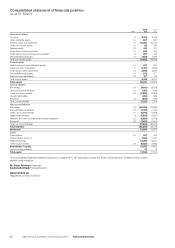
Unaudited commentary on consolidated statement of financial position
The consolidated statement of financial position shows all of
theGroup’s assets and liabilities at the year end. As a capital-
intensive business, we have significant amounts of physical
assets and corresponding borrowings.
Goodwill and other intangible assets
Goodwill and intangibles increased by £255m to £6,202m as at
31March 2016. This increase primarily relates to foreign exchange
movements of £184m and software additions of £220m, partially
offset by software amortisation of £147m.
Property, plant and equipment
Property, plant and equipment increased by £2,641m to £43,364m
as at 31 March 2016. This was principally due to capital expenditure
of £3,673m on the renewal and extension of our regulated networks
and foreign exchange movements of £543m, offset by depreciation
of £1,468m in the year. See page 24 for further details of our capital
expenditure.
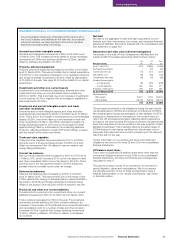
Investments and other non-current assets
Investments in joint ventures and associates, financial and other
investments and other non-current assets have increased by
£233mto £961m. This is primarily due to an increase in investments
in jointventures of £79m, together with an increase in available-for-
sale investments of £152m.
Inventories and current intangible assets, and trade
andother receivables
Inventories and current intangible assets, and trade and other
receivables have decreased by £267m to £2,909m as at 31 March
2016. This is due to an increase in inventories and current intangible
assets of £97m, more than offset by a net decrease in trade and
other receivables of £364m. The £364m decrease consists of a
foreign exchange impact of £57m due to the stronger US dollar
against sterling offset by a decrease in the underlying balances
of £421m, reflecting collection of high 2015 winter billings, coupled
with the impact of the recent mild winter.
Trade and other payables
Trade and other payables have decreased by £7m to £3,285m,
primarily due to a foreign exchange impact of £48m more than
offset by movements in the US related to warmer weather and
energy billing settlements.
Current tax balances
Net current tax balances have increased by £51m to £175m as at
31March 2016, which includes a £77m current tax asset in trade
and other receivables (£60m current tax asset in 2014/15). This is
primarily due to the tax payments made in 2015/16 being only
partially offset by a smaller current year tax charge.
Deferred tax balances
Deferred tax balances have increased by £337m to £4,634m
asat31 March 2016. This was primarily due to the impact of the
£125m deferred tax charge on actuarial gains in reserves (£299m
tax creditin 2014/15) and foreign exchange movements being
offsetby the impact of the reduction in the UK statutory tax rate.
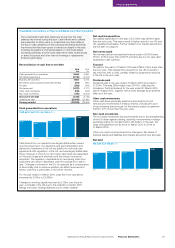
Provisions and other non-current liabilities
Provisions (both current and non-current) and other non-current
liabilities increased by £136m to £3,790m as at 31 March 2016.
Total provisions decreased by £16m in the year. The underlying
movements include additions of £63m, primarily relating to an
increase totheprovision for the estimated environmental restoration
and remediation costs for a number of sites and other provision
increases of £33m, together with foreign exchange movements
of£42m, offset by utilisation of £200m in relation to all classes
ofprovisions.
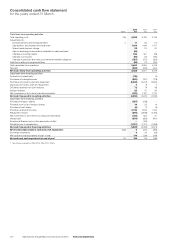
Net debt
Net debt is the aggregate of cash and cash equivalents, current
financial and other investments, borrowings, and derivative financial
assets and liabilities. See further analysis with the consolidated cash
flow statement on page 100.
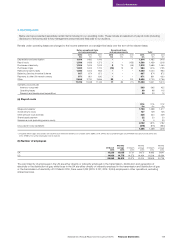
Net pension and other post-retirement obligations
A summary of the total UK and US assets and liabilities and the
overall net IAS 19 (revised) accounting deficit is shown below:
Net plan liability
UK
£m
US
£m
Total
£m
As at 1 April 2015 (672) (2,586) (3,258)
Exchange movements –(81) (81)
Current service cost (74) (147) (221)
Net interest cost (18) (94) (112)
Curtailments and other (24) (15) (39)
Actuarial (losses)/gains
– on plan assets (18) (320) (338)
– on plan liabilities 552 325 877
Employer contributions 239 348 587
As at 31 March 2016 (15) (2,570) (2,585)
Represented by:
Plan assets 19,401 7, 0 3 3 26,434
Plan liabilities (19,416) (9,603) (29,019)
(15) (2,570) (2,585)
The principal movements in net obligations during the year include
net actuarial gains of £539m and employer contributions of £587m.
Net actuarial gains include actuarial gains on plan liabilities of £877m
arising as a consequence of decreases in thenominal discount
ratein the US and experience gains reflecting liability experience
throughout the year including the impact of pension increases being
lower than assumed and some updates to the way a section of plan
liabilities is estimated. This is partially offset by actuarial losses of
£338m arising on planassets resulting from actual asset returns
being less than assumed returns which is based upon the discount
rate at the start of the year.
Further information on our pension and other post-retirement
obligations can be found in notes 22 and 29 to the consolidated
financial statements.
Off balance sheet items
There were no significant off balance sheet items other than the
contractual obligations shown in note 30(b) to the consolidated
financial statements, and the commitments and contingencies
discussed in note 27.
Through the ordinary course of our operations, we are party to
various litigation, claims and investigations. We do not expect
theultimate resolution of any of these proceedings to have a
material adverse effect on our results of operations, cash flows
orfinancial position.
Financial Statements
99National Grid Annual Report and Accounts 2015/16 Financial Statements