National Grid 2016 Annual Report Download - page 108
Download and view the complete annual report
Please find page 108 of the 2016 National Grid annual report below. You can navigate through the pages in the report by either clicking on the pages listed below, or by using the keyword search tool below to find specific information within the annual report.-
 1
1 -
2
-
3
-
4
-
5
-
6
-
7
-
8
-
9
-
10
-
11
-
12
-
13
-
14
-
15
-
16
-
17
-
18
-
19
-
20
-
21
-
22
-
23
-
24
-
25
-
26
-
27
-
28
-
29
-
30
-
31
-
32
-
33
-
34
-
35
-
36
-
37
-
38
-
39
-
40
-
41
-
42
-
43
-
44
-
45
-
46
-
47
-
48
-
49
-
50
-
51
-
52
-
53
-
54
-
55
-
56
-
57
-
58
-
59
-
60
-
61
-
62
-
63
-
64
-
65
-
66
-
67
-
68
-
69
-
70
-
71
-
72
-
73
-
74
-
75
-
76
-
77
-
78
-
79
-
80
-
81
-
82
-
83
-
84
-
85
-
86
-
87
-
88
-
89
-
90
-
91
-
92
-
93
-
94
-
95
-
96
-
97
-
 98
98 -
 99
99 -
 100
100 -
 101
101 -
 102
102 -
 103
103 -
 104
104 -
 105
105 -
 106
106 -
 107
107 -
 108
108 -
 109
109 -
 110
110 -
 111
111 -
 112
112 -
 113
113 -
 114
114 -
 115
115 -
 116
116 -
 117
117 -
 118
118 -
119
-
120
-
121
-
122
-
123
-
124
-
125
-
126
-
127
-
128
-
129
-
130
-
131
-
132
-
133
-
134
-
135
-
136
-
137
-
138
-
139
-
140
-
141
-
142
-
143
-
144
-
145
-
146
-
147
-
148
-
149
-
150
-
151
-
152
-
153
-
154
-
155
-
156
-
157
-
158
-
159
-
160
-
161
-
162
-
163
-
164
-
165
-
166
-
167
-
168
-
169
-
170
-
171
-
172
-
173
-
174
-
175
-
176
-
177
-
178
-
179
-
180
-
181
-
182
-
183
-
184
-
185
-
186
-
187
-
188
-
189
-
190
-
191
-
192
-
193
-
194
-
195
-
196
-
197
-
198
-
199
-
200
-
201
-
202
-
203
-
204
-
205
-
206
-
207
-
208
-
209
-
210
-
211
-
212
 |
 |

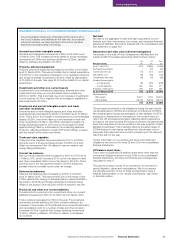
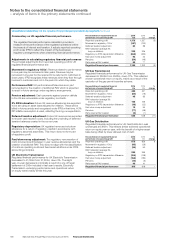
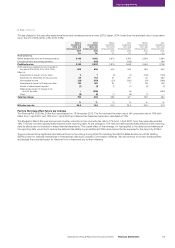
2. Segmental analysis continued
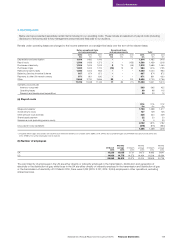
(b) Operating profit
A reconciliation of the operating segments’ measure of profit to total profit before tax is provided below. Further details of the exceptional items
and remeasurements are provided in note 4.
Before exceptional items
andremeasurements
After exceptional items
andremeasurements
2016
£m
2015
£m
2014
£m
2016
£m
2015
£m
2014
£m
Operating segments:
UK Electricity Transmission 1,173 1,237 1,087 1,173 1,237 1,027
UK Gas Transmission 486 437 417 486 437 406
UK Gas Distribution 878 826 904 878 826 780
US Regulated 1,18 5 1,16 4 1,125 1,196 1,081 1,388
Other activities 374 199 131 352 199 134
4,096 3,863 3,664 4,085 3,780 3,735
Geographical areas:
UK 2,889 2,820 2,723 2,867 2,820 2,531
US 1,207 1,043 941 1,218 960 1,204
4,096 3,863 3,664 4,085 3,780 3,735
Reconciliation to profit before tax:
Operating profit 4,096 3,863 3,664 4,085 3,780 3,735
Finance income 22 36 36 22 36 36
Finance costs (1,035) (1,069) (1,14 4) (1,134) (1,234) (1,051)
Share of post-tax results of joint ventures and associates 59 46 28 59 46 28
Profit before tax 3,142 2,876 2,584 3,032 2,628 2,748
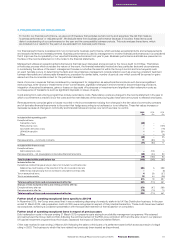
(c) Capital expenditure
Net book value of property,
plantand equipment and other
intangible assets Capital expenditure Depreciation and amortisation
2016
£m
2015
£m
2014
£m
2016
£m
2015
£m
2014
£m
2016
£m
2015
£m
2014
£m
Operating segments:
UK Electricity Transmission 11,907 11,276 10,635 1,084 1,074 1,381 (390) (376) (343)
UK Gas Transmission 4,140 4,132 4,120 186 184 181 (178) (172) (172)
UK Gas Distribution 8,378 8,130 7, 9 21 549 498 480 (298) (286) (271)
US Regulated 17,490 15,664 12,948 1,856 1,501 1,219 (535) (452) (419)
Other activities 2,336 2,323 2,224 218 213 180 (213) (196) (211)
44,251 41,525 3 7,8 4 8 3,893 3,470 3,441 (1,614) (1,482) (1,416)
Geographical areas:
UK 25,914 25,073 24,285 1,952 1,864 2,155 (1,018) (983) (938)
US 18,337 16,452 13,563 1,941 1,606 1,286 (596) (499) (478)
44,251 41,525 3 7,8 4 8 3,893 3,470 3,441 (1,614) (1,482) (1,416)
By asset type:
Property, plant and equipment 43,364 40,723 37,179 3,673 3,263 3,262 (1,467) (1,361) (1,289)
Non-current intangible assets 887 802 669 220 207 179 (147) (121) (127)
44,251 41,525 3 7,8 4 8 3,893 3,470 3,441 (1,614) (1,482) (1,416)
Total non-current assets other than financial instruments and pension assets located in the UK and US were £26,261m and £23,784m
respectively as at 31 March 2016 (31 March 2015: UK £25,278m, US £21,790m; 31 March 2014: UK £24,531m, US £18,349m).
Notes to the consolidated financial statements
– analysis of items in the primary statements continued
106 National Grid Annual Report and Accounts 2015/16 Financial Statements