National Grid 2016 Annual Report Download - page 79
Download and view the complete annual report
Please find page 79 of the 2016 National Grid annual report below. You can navigate through the pages in the report by either clicking on the pages listed below, or by using the keyword search tool below to find specific information within the annual report.-
 1
1 -
2
-
3
-
4
-
5
-
6
-
7
-
8
-
9
-
10
-
11
-
12
-
13
-
14
-
15
-
16
-
17
-
18
-
19
-
20
-
21
-
22
-
23
-
24
-
25
-
26
-
27
-
28
-
29
-
30
-
31
-
32
-
33
-
34
-
35
-
36
-
37
-
38
-
39
-
40
-
41
-
42
-
43
-
44
-
45
-
46
-
47
-
48
-
49
-
50
-
51
-
52
-
53
-
54
-
55
-
56
-
57
-
58
-
59
-
60
-
61
-
62
-
63
-
64
-
65
-
66
-
67
-
68
-
 69
69 -
 70
70 -
 71
71 -
 72
72 -
 73
73 -
 74
74 -
 75
75 -
 76
76 -
 77
77 -
 78
78 -
 79
79 -
 80
80 -
 81
81 -
 82
82 -
 83
83 -
 84
84 -
 85
85 -
 86
86 -
 87
87 -
 88
88 -
 89
89 -
90
-
91
-
92
-
93
-
94
-
95
-
96
-
97
-
98
-
99
-
100
-
101
-
102
-
103
-
104
-
105
-
106
-
107
-
108
-
109
-
110
-
111
-
112
-
113
-
114
-
115
-
116
-
117
-
118
-
119
-
120
-
121
-
122
-
123
-
124
-
125
-
126
-
127
-
128
-
129
-
130
-
131
-
132
-
133
-
134
-
135
-
136
-
137
-
138
-
139
-
140
-
141
-
142
-
143
-
144
-
145
-
146
-
147
-
148
-
149
-
150
-
151
-
152
-
153
-
154
-
155
-
156
-
157
-
158
-
159
-
160
-
161
-
162
-
163
-
164
-
165
-
166
-
167
-
168
-
169
-
170
-
171
-
172
-
173
-
174
-
175
-
176
-
177
-
178
-
179
-
180
-
181
-
182
-
183
-
184
-
185
-
186
-
187
-
188
-
189
-
190
-
191
-
192
-
193
-
194
-
195
-
196
-
197
-
198
-
199
-
200
-
201
-
202
-
203
-
204
-
205
-
206
-
207
-
208
-
209
-
210
-
211
-
212
 |
 |

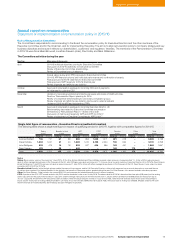
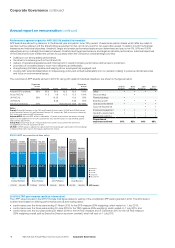
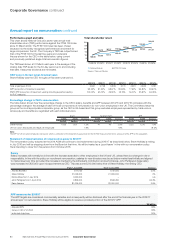
The performance achieved against the targets, including the expected vesting percentage for the RoE measures, was:
Performance measure Threshold – 25% vesting Maximum – 100% vesting Actual/expected vesting
Actual/expected
proportion of
maximum achieved
TSR ranking (25% weighting) Ranked at median of the
comparator group (FTSE 100)
7.5 percentage points or more
above median
2.99 percentage points
above median
55.0%
Adjusted EPS (50% weighting) EPS growth exceeds RPI increase
by 3 percentage points
EPS growth exceeds RPI increase
by 8 percentage points or more
Exceeded RPI increase by
6.3 percentage points
74.4%
UK RoE (12.5% weighting for
the CEO and Finance Director;
25% weighting for the Executive
Director, UK)
RoE is equal to the average
allowed regulatory return
RoE is 2 percentage points or
more above the average allowed
regulatory return
Exceeded average allowed
regulatory return by
3.2 percentage points
100.0%
US RoE (12.5% weighting for
the CEO and Finance Director;
25% weighting for the former
Executive Director, US)
RoE is 1 percentage point
below the average allowed
regulatory return
RoE is 1 percentage point
or more above the average
allowed regulatory return
1.1 percentage points below the
average allowed regulatory return
0%
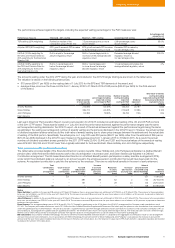
The amounts vesting under the 2012 LTPP during the year and included in the 2015/16 single total figure are shown in the table below.
The valuation is based on the following share prices:
• 818 pence ($64.17 per ADS) on the vesting date of 1 July 2015 for the EPS and TSR elements of the award; and
• average share price over the three months from 1 January 2016 to 31 March 2016 of 958 pence ($69.23 per ADS) for the RoE element
of the award.
Original number
of share awards
in 2012 LTPP
Overall vesting
percentage (including
expected vesting
percentage for RoE
measure)
Number of awards
vesting (including
expected
vesting for RoE
measure)
Dividend
equivalent
shares
Total value of awards
vesting (including
expected vesting for RoE
measure) and dividend
equivalent shares
(£’000)
Andrew Bonfield 213,095 63.45% 135,203 23,787 1,345
Steve Holliday 336,702 63.45% 213,628 3 7, 5 8 6 2,125
John Pettigrew 52,395 75.95% 39,793 7,13 6 406
Dean Seavers – – – – –
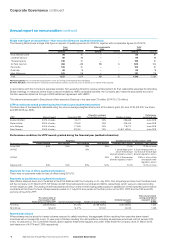
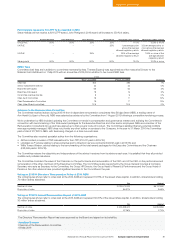
Last year’s Directors’ Remuneration Report covering remuneration for 2014/15 included an estimated vesting of the US and UK RoE portions
of the 2011 LTPP award. These awards vested on 1 July 2015 and the performance achieved against the performance targets was the same
as the expected vesting disclosed in the 2014/15 report. As a result of the actual achievement against the performance targets being the same
as estimated, the vesting percentage and number of awards vesting are the same as disclosed in the 2014/15 report. However, the actual number
of dividend equivalent shares varied as did the total value of awards vesting due to share price changes between the estimate and the actual date
of vesting of the RoE portion. Specifically, the actual price on 1 July 2015 was 818 pence ($64.17 per ADS) rather than the estimate of 899 pence
($70.33 per ADS) disclosed in the 2014/15 report based on the average price from 1 January 2015 to 31 March 2015. As a result, the actual
numbers of dividend equivalent shares granted for the 2011 LTPP were 22,454, 35,440 and 7,261 and the actual values of the awards at vesting
were £29,358, £46,335 and £12,441 lower than originally estimated for Andrew Bonfield, Steve Holliday and John Pettigrew respectively.
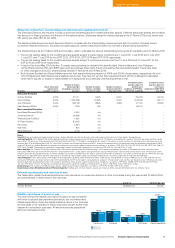
Total pension benefits (audited information)
The table below provides details of the Executive Directors’ pension benefits. Steve Holliday and John Pettigrew participate in a Defined Benefit
pension plan, whilst Andrew Bonfield receives cash in lieu of participation in a pension plan, and Dean Seavers participates in a Defined
Contribution arrangement. The UK-based Executive Directors in a Defined Benefit pension participate in a salary sacrifice arrangement (FPS),
under which the individual’s salary is reduced by an amount equal to the employee pension contribution that would have been paid into the
scheme. An equivalent contribution is paid into the scheme by the employer. There are no additional benefits in the event of early retirement.
Total
contributions
to DC
arrangement
£’000
Cash in lieu of
pension
contributions
£’000
Accrued
DB pension
at 31 March 2016
£’000 pa
Increase
in accrued
DB pension
over year
£’000 pa
Reduction
in salary
due to FPS
£’000
Increase/
(decrease) in
any lump sum
£’000
Value of
pension benefit
calculated using
BIS methodology
£’000
Normal
retirement
date
Andrew Bonfield –221 – – – – 221 17/08/2027
Steve Holliday – – 591 39 62 2730 26/10/2016
John Pettigrew – – 151 729 23 143 26/10/2031
Dean Seavers 148 –––––148 30/08/2025
Notes:
Steve Holliday: In addition to the accrued DB pension at 31 March 2016 above, there is an accrued lump sum entitlement of £129,000 as at 31 March 2016. The increase to the accumulated
lump sum, net of inflation, was £2,000 in the year to 31 March 2016. The increase in accrued DB pension over the year shown above is net of inflation, as UK pensions in payment or deferment
increase in line with inflation.
John Pettigrew: In addition to the accrued DB pension at 31 March 2016 above, there is an accrued lump sum entitlement of £452,000 as at 31 March 2016. The increase to the accumulated
lump sum, net of inflation, was £23,000 in the year to 31 March 2016. The increase in accrued DB pension over the year shown above is net of inflation, as UK pensions in payment or deferment
increase in line with inflation.
Dean Seavers: The average exchange rate for 2015/16 was $1.4744:£1. Through his participation in the 401(k) plan in the US (a DC arrangement) the Company made contributions worth
£27,400. The Company also made contributions worth £121,049 to the Non-Qualified Executive Supplemental Retirement Plan which pays the portion of core contributions that cannot be paid
under the qualified plan due to IRS limitations. The plan also provides a supplemental top-up benefit through additional company contributions to yield an overall company contribution of 9% of
pensionable pay, including both the qualified and non-qualified plan benefits. The retirement date shown is the typical retirement age in the US. The 401(k) plan does not have a retirement age.
Benefits can be taken without penalty on leaving the Company from age 55 (subject to vesting requirements) or can be rolled over into another qualifying plan.
BIS calculation: In accordance with BIS methodology, the pension benefit for Andrew Bonfield and Dean Seavers is calculated as the aggregate of contributions made to a DC arrangement
and cash in lieu of pension contributions. Also in accordance with BIS methodology, the pension benefit for Steve Holliday and John Pettigrew is calculated as the increase in accrued DB
pension over the year shown above multiplied by 20 plus the increase in the lump sum shown above, less the reduction in salary due to FPS. Each element is calculated separately and rounded
to produce the numbers in the table above.
77National Grid Annual Report and Accounts 2015/16
Corporate Governance
Annual report on remuneration