Napa Auto Parts 2007 Annual Report Download - page 21
Download and view the complete annual report
Please find page 21 of the 2007 Napa Auto Parts annual report below. You can navigate through the pages in the report by either clicking on the pages listed below, or by using the keyword search tool below to find specific information within the annual report.-
 1
1 -
2
-
3
-
4
-
5
-
6
-
7
-
8
-
9
-
10
-
 11
11 -
 12
12 -
 13
13 -
 14
14 -
 15
15 -
 16
16 -
 17
17 -
 18
18 -
 19
19 -
 20
20 -
 21
21 -
 22
22 -
 23
23 -
 24
24 -
 25
25 -
 26
26 -
 27
27 -
 28
28 -
 29
29 -
 30
30 -
 31
31 -
32
-
33
-
34
-
35
-
36
-
37
-
38
-
39
-
40
-
41
-
42
-
43
-
44
-
45
-
46
-
47
-
48
 |
 |

19
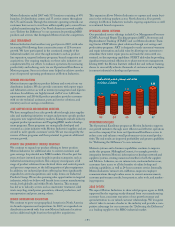
Net income was $475 million in 2006, up 9% from $437 million
in 2005, and on a per share diluted basis, net income was $2.76
in 2006 compared to $2.50 in 2005. Net income in 2006 and
2005 was 4.5% of net sales.
Share-Based Compensation
Effective January 1, 2006 the Company adopted Statement
of Financial Accounting Standards (“SFAS”) No. 123(R) choosing
the “modified prospective” method. Compensation cost recognized
for the year ended December 31, 2006 includes: (a) compensation
cost for all share-based payments granted prior to, but not yet vested
as of January 1, 2006, based on the grant date fair value estimated in
accordance with the original provisions of SFAS No. 123, and (b)
compensation cost for all share-based payments granted subsequent
to January 1, 2006, based on the grant date fair value estimated with
the provisions of SFAS No. 123(R). Results for prior periods have
not been restated. Most options may be exercised not earlier than
twelve months nor later than ten years from the date of grant. As of
January 1, 2006, there was approximately $1.2 million of unrecog-
nized compensation cost for all awards granted prior to January 1,
2003 to employees that remained unvested prior to the effective date
of SFAS No. 123(R). is compensation cost is being recognized
over a weighted-average period of approximately four years. For
the year ended December 31, 2007, total compensation cost related
to nonvested awards not yet recognized was approximately $21.7
million. e weighted-average period over which this compensation
cost is expected to be recognized is approximately three years. For
the years ended December 31, 2007, 2006 and 2005, $14.3 mil-
lion, $11.9 million and $6.9 million of share-based compensation
cost was recorded, respectively. ere have been no modifications to
valuation methodologies or methods subsequent to the adoption of
SFAS No. 123(R).
Financial Condition
e major consolidated balance sheet categories at December 31,
2007, with the exception of the accounts discussed below, were
relatively consistent with the December 31, 2006 balance sheet
categories. e Company’s cash balances increased $96 million
or 71% from December 31, 2006, due primarily to improved
earnings and working capital management. e Company also
received $56 million in net proceeds on a sale-leaseback trans-
action in the fourth quarter of 2007, discussed further under
Contractual and Other Obligations. Our accounts receivable
balance at December 31, 2007 decreased 1% compared to the
prior year, which is considerably favorable to our increase in
revenues for the fourth quarter and year. Inventory at December
31, 2007, was up 4% from December 31, 2006, in line with our
increase in revenues for the year. Prepaid expenses and other
current assets increased $34 million or 15% from December 31,
2006, reflecting the increase in receivables due from vendors.
Accounts payable at December 31, 2007 increased $80 million
or 9% from the prior year, due primarily to increased purchases
related to sales growth, extended terms with certain suppliers and
the increased utilization of procurement cards in 2007.
Liquidity and Capital Resources
e ratio of current assets to current liabilities was 2.6 to 1 at
December 31, 2007 compared to 3.2 to 1 at December 31, 2006.
e change in current ratio was primarily due to the reclassification
of $250 million in long-term debt maturing November 2008.
Our cash position remains strong. e Company had $500 million
in total debt outstanding at December 31, 2007 and 2006.
A summary of the Company’s consolidated statements of cash
flows is as follows:
Year Ended December 31,
Net Cash (in thousands) Percent Change
Provided by 2007 vs. 2006 vs.
(Used in): 2007 2006 2005 2006 2005
Operating
Activities $ 641,471 $ 433,500 $ 440,517 48% -2%
Investing
Activities (87,598) (145,599) (70,174) -40% 107%
Financing
Activities (469,496) (340,729) (317,469) 38% 7%
Net Cash Provided by Operating Activities:
e Company continues to generate excellent cash flows and
2007 was an especially strong year, with net cash provided by
operating activities increasing 48% to $641 million. e 7%
increase in net income and working capital gains during the year
resulted in a significant increase in cash from operations com-
pared to 2006. In 2006, the Company generated $434 million
in cash from operations, a slight decrease from 2005 primarily
due to the use of cash for working capital requirements during
the year, which offset the 9% increase in net income compared
to 2005. e Company believes existing credit facilities and cash
generated from operations will be sufficient to fund its future
operations, and to meet its cash requirements.
Net Cash Used in Investing Activities:
Cash flow used in investing activities was $88 million in 2007
compared to $146 million in 2006, a decrease of 40%. Primarily,
the decrease in investing activities was due to the sale-leaseback
transaction for certain real properties, which closed during the
year. is transaction provided the Company $56 million in cash
proceeds. e decrease in capital expenditures and increase in
cash used for acquisitions relative to 2006 were offsetting investing
activities in 2007. In 2006, cash flow used in investing activities
increased substantially from 2005, as capital expenditures
increased to $126 million in 2006 compared to approximately
$86 million in 2005.