Napa Auto Parts 2007 Annual Report Download - page 19
Download and view the complete annual report
Please find page 19 of the 2007 Napa Auto Parts annual report below. You can navigate through the pages in the report by either clicking on the pages listed below, or by using the keyword search tool below to find specific information within the annual report.-
 1
1 -
2
-
3
-
4
-
5
-
6
-
7
-
8
-
 9
9 -
 10
10 -
 11
11 -
 12
12 -
 13
13 -
 14
14 -
 15
15 -
 16
16 -
 17
17 -
 18
18 -
 19
19 -
 20
20 -
 21
21 -
 22
22 -
 23
23 -
 24
24 -
 25
25 -
 26
26 -
 27
27 -
 28
28 -
 29
29 -
30
-
31
-
32
-
33
-
34
-
35
-
36
-
37
-
38
-
39
-
40
-
41
-
42
-
43
-
44
-
45
-
46
-
47
-
48
 |
 |

Automotive reported progress in 2007. While this level of
growth does not meet our expectations for the longer term, we
remain encouraged by this group’s drive to generate positive
and consistent sales growth in the year ahead.
Automotive sales increased by 3% to $5.2 billion in 2006. After
achieving sales increases of 5% in both the first and second
quarters of 2006, our sales growth slowed to 1% growth in the
third quarter, followed by a 2% increase in the fourth quarter.
Automotive’s sales initiatives, including the addition of 64 net
new NAPA AUTO PARTS stores and the continued expansion
of NAPA AutoCare programs, were somewhat impacted by
the effect of higher gasoline prices on vehicle miles driven and
aftermarket product demand. Both of these factors influenced
our sales trends for the year. Additionally, our core NAPA sales
increase of 5% was offset by a sales decrease at Johnson Indus-
tries, which was downsized in 2005.
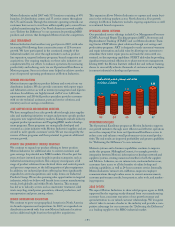
Industrial Group
Net sales for Motion Industries, our Industrial Group (“Indus-
trial”), were $3.4 billion in 2007, an increase of 8% compared to
2006. In 2007, this group recorded strong and consistent sales
growth, with revenues increasing from 7% to 9% in each quarter
of the year. Industrial has participated in the continued strength
of the markets it serves through initiatives such as product
line expansion, targeted industry programs, branch expansion
and acquisitions. is year, Industrial expanded its distribution
network by opening four new locations and by adding another
eight locations via five acquisitions. Industrial’s growth plans,
combined with ongoing steady demand from its manufacturing
customer base, should allow this group to generate more strong
results in 2008.
Net sales in 2006 were $3.1 billion, representing the third con-
secutive year of 11% sales growth. In 2006, this group recorded
steady progress throughout the year, with double-digit growth
in each quarter. In addition, Industrial expanded its distribution
network in 2006 by opening 10 new locations and by adding
another 31 locations via two acquisitions.
Office Group
Net sales for S.P. Richards, our Office Products Group (“Office”),
were $1.8 billion, down 1% compared to the prior year. Office is
commonly recognized as our most steady performer from year to
year, but weak demand in the overall office products industry, which
we began to see in 2006, negatively impacted our results in 2007.
Primarily, the depressed sales activity with our national accounts
customer base offset the steady sales growth to independent
dealers during the year. After a 3% sales decrease in the first
quarter, sales increased 1% in the second quarter, were flat in the
third quarter and decreased 1% in the fourth quarter. A gradual
strengthening in the industry combined with product and
customer expansion efforts and the continued development of
effective marketing programs and dealer services should support
growth for Office in the year ahead.
Net sales in 2006 were $1.8 billion, up 7% over 2005. is
represented a solid increase for the Office group and reflects the
success of its ongoing business expansion strategy. Among the
quarters, however, the rate of sales growth decreased as market
conditions became more difficult during the year. Sales increased
13% in the first quarter, 6% in the second quarter, 5% in the third
quarter and 4% in the fourth quarter.
Electrical Group
Net sales for EIS, our Electrical and Electronic Group (“Electrical”),
increased by 7% to $436 million in 2007. e sales progress at
Electrical reflects favorable market conditions, as evident through
continued manufacturing expansion in the U.S. Also, this group’s
focus on new products and markets, geographic expansion and
strategic customer and supplier relationships serve as key sales
initiatives at Electrical. During 2007, sales were up 12% in the
first quarter, 7% in the second quarter, 4% in the third quarter
and 6% in the fourth quarter. We expect the strategic initiatives
in place at Electrical as well as stable market conditions to drive
additional sales progress for Electrical in 2008.
Net sales were up 20% to $408 million in 2006 compared to the
prior year. is strong growth reflected the continued manufacturing
expansion in the U.S. during the year, as well as this group’s com-
mitment to ongoing sales initiatives. During 2006, sales were up
13% in the first quarter, 24% in the second quarter, 23% in the
third quarter and 17% in the fourth quarter.
Cost of Goods Sold
Cost of goods sold was $7.6 billion, $7.4 billion and $6.9 billion
in 2007, 2006 and 2005, respectively, representing 70.3% of net
sales in 2007 and 2006, down slightly from 70.4% of net sales
in 2005. Over these periods, ongoing gross margin initiatives to
enhance our pricing strategies, promote and sell higher margin
products and minimize material acquisition costs were offset by
increasing competitive pricing pressures in the markets we serve.
In 2005, 2006 and 2007, each of our four business segments
experienced vendor price increases, and by working with our
customers we were able to pass some of these along to them,
particularly in Industrial.
Operating Expenses
Selling, administrative and other expenses (“SG&A”) increased
to $2.3 billion in 2007, representing 21.0% of net sales and down
slightly from 21.2% of net sales in 2006. SG&A expenses as a
percentage of net sales reflect the benefits of our ongoing cost
control initiatives. Our cost management initiatives continue
17