Napa Auto Parts 2007 Annual Report Download - page 20
Download and view the complete annual report
Please find page 20 of the 2007 Napa Auto Parts annual report below. You can navigate through the pages in the report by either clicking on the pages listed below, or by using the keyword search tool below to find specific information within the annual report.-
 1
1 -
2
-
3
-
4
-
5
-
6
-
7
-
8
-
9
-
 10
10 -
 11
11 -
 12
12 -
 13
13 -
 14
14 -
 15
15 -
 16
16 -
 17
17 -
 18
18 -
 19
19 -
 20
20 -
 21
21 -
 22
22 -
 23
23 -
 24
24 -
 25
25 -
 26
26 -
 27
27 -
 28
28 -
 29
29 -
 30
30 -
31
-
32
-
33
-
34
-
35
-
36
-
37
-
38
-
39
-
40
-
41
-
42
-
43
-
44
-
45
-
46
-
47
-
48
 |
 |

18
Management’sDiscussionandAnalysisofFinancialConditionandResultsofOperations(continued)
2007
to emphasize continuous improvement programs designed to
optimize our utilization of people and systems. We were pleased
with the success of our initiatives in 2007 and expect our SG&A
expenses as a percentage of sales to show additional progress in
the foreseeable future. Depreciation and amortization expense
in 2007 was $88 million, up 19% from 2006, and relates to an
increased level of capital expenditures in 2006 and 2007 relative
to 2005. e provision for doubtful accounts was $14 million in
2007, down from a $16 million bad debt expense in 2006.
In 2006, SG&A increased slightly to $2.2 billion, or 21.2% of
net sales, consistent with SG&A as a percent of net sales in 2005.
Depreciation and amortization expense in 2006 was $73 million,
up 12% from 2005, and corresponds to the increase in capital
expenditures in 2006 relative to the prior year. e provision for
doubtful accounts was $16 million in 2006, consistent with our
bad debt expense in 2005.
Non-Operating Expenses and Income
Non-operating expenses consist primarily of interest. Interest
expense was $31 million, $32 million and $34 million in 2007,
2006 and 2005, respectively. e decrease in interest expense in
2006 compared to 2005 was primarily due to the termination
of an interest rate swap agreement in 2006.
In “Other”, interest income net of minority interests increased in
2007 from the prior two years due to the change in interest income
earned on the Company’s improved cash balances during the year.
Income Before Income Taxes
Income before income taxes was $817 million in 2007, an
increase of 5.9% from $771 million in 2006. As a percentage
of net sales, income before income taxes was 7.5% in 2007,
reflecting a slight increase from 7.4% in 2006. e improvement
in 2007 represents a continuing trend for the Company.
In 2006, income before income taxes of $771 million was up
8.7% from $709 million in 2005 and as a percentage of net
sales was 7.4%, up from 7.2% in 2005.
Automotive Group
Automotive operating profit as a percentage of net sales, which we
refer to as operating margin, increased to 7.8% in 2007 from 7.7%
in 2006. Our progress in 2007 primarily related to certain non-
recurring costs incurred in 2006 for certain closing and consolidation
expenses at Johnson Industries and our re-manufacturing opera-
tions. Based on our initiatives to grow sales and control costs in
2008, we expect Automotive operating margins to show improve-
ment in the year ahead.
Automotive operating margins decreased to 7.7% in 2006 from
7.9% in 2005. During 2006, the Company recorded non-recurring
costs associated with certain closing and consolidation expenses
at Johnson Industries and our re-manufacturing operations. At
Johnson Industries, we sold or closed eight of twelve locations
during 2005, resulting in selling and closure costs in that year,
and we incurred additional closing costs to downsize these oper-
ations in 2006. At our re-manufacturing operations, we incurred
costs during the year related to certain facility consolidations.
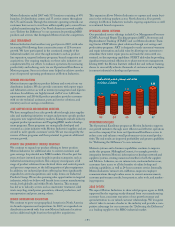
Industrial Group
Industrial operating margins increased to 8.4% in 2007 from 8.3%
in 2006 and 7.7% in 2005. is ongoing margin improvement for
Industrial reflects the effectiveness of our sales and operating ini-
tiatives, as well as the relative strength of the industries served by
Industrial over these periods. We expect to show more progress
in Industrial in 2008.
Office Group
Operating margins in Office were 8.9% in 2007, down from
9.4% in 2006 and 9.5% in 2005. Office continues to generate
industry leading operating margins, but the impact of weakening
demand in the office products industry experienced over the last
half of 2006 and in 2007 has negatively influenced this trend.
In addition, competitive pricing pressures over these periods
have affected the margins at Office. ese pressures are partially
offset by ongoing product and customer expansion efforts and
the continued development of effective marketing programs and
dealer services. rough these initiatives, we believe Office will
show progress in 2008.
Electrical Group
Operating margins in Electrical increased to 7.0% in 2007 from
5.5% in 2006. is represents the fourth consecutive year of
margin improvement for Electrical and reflects the continued
strength in the manufacturing sector of the economy in 2007,
combined with Electrical’s successful growth strategy during
this period. Operating margins in Electrical increased to 5.5%
in 2006 from 5.1% in 2005. We are encouraged by the ongoing
progress we see in Electrical.
Income Taxes
e effective income tax rate decreased to 38.0% in 2007 from
38.3% in 2006. e decrease in the effective rate in 2007 was
primarily due to lower state taxes and favorable tax rate changes
in Canada. e effective income tax rate of 38.3% in 2006 was
unchanged from the effective income tax rate in 2005.
Net Income
Net income was $506 million in 2007, an increase of 7% from
$475 million in 2006. On a per share diluted basis, net income
was $2.98 in 2007 compared to $2.76 in 2006, up 8%. is
increase follows two consecutive years of double-digit growth in
diluted earnings per share. Net income in 2007 was 4.7% of net
sales compared to 4.5% of net sales in 2006.