Napa Auto Parts 2004 Annual Report Download - page 6
Download and view the complete annual report
Please find page 6 of the 2004 Napa Auto Parts annual report below. You can navigate through the pages in the report by either clicking on the pages listed below, or by using the keyword search tool below to find specific information within the annual report.-
 1
1 -
 2
2 -
 3
3 -
 4
4 -
 5
5 -
 6
6 -
 7
7 -
 8
8 -
 9
9 -
 10
10 -
 11
11 -
 12
12 -
 13
13 -
 14
14 -
 15
15 -
 16
16 -
 17
17 -
18
-
19
-
20
-
21
-
22
-
23
-
24
-
25
-
26
-
27
-
28
-
29
-
30
-
31
-
32
-
33
-
34
-
35
-
36
-
37
-
38
-
39
-
40
-
41
-
42
-
43
-
44
 |
 |

4
We will remember 2004 as a year we can be proud of for a number
of reasons.
•Record levels of sales and profits were achieved.
•All four of our business segments contributed to our success in a
significant and positive way.
•Our GPC share price grew by 33% for the year providing an
outstanding return to our shareholders.
•Our balance sheet became even stronger with the generation of
$555 million in operating cash flow and with total debt reduced by
$177 million.
•A number of significant management changes occurred that will
assure us a high level of experienced and energetic leadership as
we move ahead.
The list could certainly be longer but perhaps we should move along
and give you a bit more detail on the fine year we had in 2004 and
some of our thoughts about next year and the future for GPC.
Total sales for 2004 reached a record $9.1 billion, an increase of 8%
compared to 2003. We started the year with a strong first quarter and
the pattern was consistent with notable improvement in the second,
third and fourth quarters. Net earnings of $396 million were up 12%
compared to 2003 before the cumulative effect of an accounting
change adopted January 1, 2003. Earnings per share were $2.25 in
2004 compared to $2.03 in 2003 before the accounting change. After
the cumulative effect, both net income and earnings per share were
up 18% over 2003.
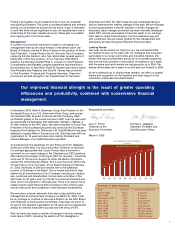
Financial Strength
In 2004, we were able to strengthen our already sound balance
sheet and the Company is in excellent financial condition. Our ratio
of current assets to current liabilities was 3.2/1 at year-end, and we
generated especially strong cash flows, with approximately $555
million in cash flow from operations for 2004. During the year, we
invested $72 million in capital expenditures for our businesses and
we reduced total debt by approximately $177 million. For the third
consecutive year now, we have managed to significantly reduce our
debt, and our total debt to total capitalization ratio moved down to
16% from 23% in 2003. Our improved financial strength is the result
of greater operating efficiencies and productivity, combined with
conservative financial management.
As part of our gradual share repurchase plan, the Company also
used cash to purchase nearly 600,000 shares of our Company stock
during 2004. Currently, we have an additional 6.0 million shares
authorized for repurchase and we will remain active in the plan on
an opportunistic basis in 2005.
Dividends
In 2004, the Company continued its record of paying a dividend every
year since going public in 1948. 2004 was our 48th consecutive year
of increases, with dividends improving to $1.20 per share. We are
proud of our dividend record and we are once again pleased to
report that on February 21, 2005, the Board of Directors raised the
cash dividend payable April 1, 2005 to an annual rate of $1.25 per
share, or 56% of our 2004 earnings. This becomes our 49th consec-
utive year of dividend improvement.
Progress in Operations
As we mentioned earlier in our remarks, all our business segments
contributed significantly to our growth in sales and earnings for the
year. We will not go into great detail in these comments, but we
invite you to read more about our accomplishments and plans for
each group in the following pages of our report. Operating margin
improvement can also be seen in detail in the segment financial data
provided in this Annual Report. We are pleased with our progress in
this aspect of our business and it was a priority in 2004.
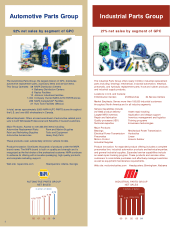
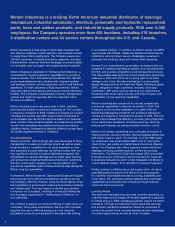
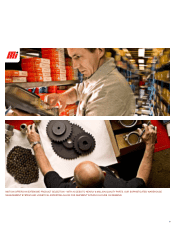
Our strongest sales improvement for the year came from our two
business segments directly serving the manufacturing sector of the
economy. Motion Industries, our Industrial Products Group, had an
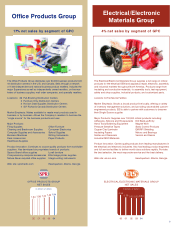
excellent year with an 11% increase in sales. EIS, our Electrical/
Electronic segment, was also favorably impacted by the upturn in
the U.S. manufacturing sector and they posted a 13% sales increase
for the year. As we enter 2005, we are encouraged by the strength of
the U.S. industrial production numbers, which lends great support
for future growth at Motion and EIS.
In 2004, sales for both the Automotive Group and the Office Products
Group increased 6%. This was the best performance from these
groups in several years and we are encouraged by this improvement.
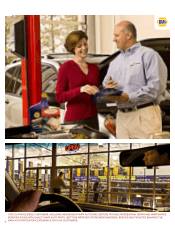
Automotive, our largest business group, continues to have market
conditions that bode well for their activities in 2005 and the future.
The age and mix of the vehicle population on our roads today, and
continued growth of miles driven, creates a splendid opportunity for
us in this business. S.P. Richards, our office products company, is
our most consistent performer, finding a way to add growth every
year, with an expanding customer base and numerous product
enhancements.
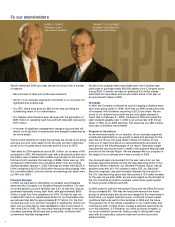
To our shareholders
LARRY L. PRINCE THOMAS C. GALLAGHER
Chairman of the Chairman, President and
Executive Committee Chief Executive Officer