Napa Auto Parts 2004 Annual Report Download - page 15
Download and view the complete annual report
Please find page 15 of the 2004 Napa Auto Parts annual report below. You can navigate through the pages in the report by either clicking on the pages listed below, or by using the keyword search tool below to find specific information within the annual report.-
 1
1 -
2
-
3
-
4
-
 5
5 -
 6
6 -
 7
7 -
 8
8 -
 9
9 -
 10
10 -
 11
11 -
 12
12 -
 13
13 -
 14
14 -
 15
15 -
 16
16 -
 17
17 -
 18
18 -
 19
19 -
 20
20 -
 21
21 -
 22
22 -
 23
23 -
 24
24 -
 25
25 -
26
-
27
-
28
-
29
-
30
-
31
-
32
-
33
-
34
-
35
-
36
-
37
-
38
-
39
-
40
-
41
-
42
-
43
-
44
 |
 |

13
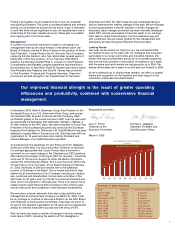
Market and Dividend information
High and Low Sales Price and Dividends per Common Share Traded on the New York Stock Exchange
Sales Price of Common Shares
Quarter 2004 2003
High Low High Low
First $35.06 $32.03 $31.88 $27.43
Second 40.20 32.65 33.66 30.70
Third 39.94 36.10 33.45 30.03
Fourth 44.32 36.51 33.20 30.78
Dividends Declared Per Share
2004 2003
First $0.30 $0.295
Second 0.30 0.295
Third 0.30 0.295
Fourth 0.30 0.295
Number of Record Holders of Common Stock as of December 31, 2004: 7,559
*The cumulative effect of a change in accounting principle in 2003 represents a non-cash charge related to cash consideration received from vendors in conjunction
with the Financial Accounting Standards Board's EITF 02-16. Had the Company accounted for vendor consideration in accordance with EITF 02-16 in prior years,
there would have been no significant impact on net income (loss) and diluted income (loss) per share for the years ended December 31, 2002, 2001, and 2000.
Furthermore, approximately $90 million, $111 million, and $82 million would have been reclassified from selling, administrative and other expenses to cost of goods
sold for the years ended December 31, 2002, 2001, and 2000, respectively.
** The cumulative effect of a change in accounting principle in 2002 represents a non-cash charge related to the impairment testing for goodwill in conjunction with
the Statement of Financial Accounting Standards No. 142 “Goodwill and Other Intangible Assets”. If the Company had applied the non-amortization provisions of
Statement 142 for all periods presented, net income and diluted income per common share would have increased by approximately $11.9 million ($.07 per share)
and $11.4 million ($.06 per share) for the years ended December 31, 2001 and 2000.
*** Facility Consolidation, Impairment and Other Charges ("2001 Charges") totaled $107.8 million pre-tax in 2001 and $64.4 million after tax. The pre-tax charges include
$17.4 million classified in cost of goods sold and $16.4 million classified in selling, administrative and other expenses. Diluted net income per common share before
the 2001 Charges was $2.08.
Selected Financial Data
(in thousands, except per share data) Year ended December 31, 2004 2003 2002 2001 2000
Net sales $9,097,267 $8,449,300 $ 8,258,927 $ 8,220,668 $ 8,369,857
Cost of goods sold 6,267,544 5,826,684 5,704,749 5,699,174*** 5,764,360
Selling, administrative and other expenses 2,193,804 2,050,873 1,948,442 1,951,559*** 1,958,747
Facility consolidation and impairment charges
—— — 73,922
***
—
Income before taxes and accounting change 635,919 571,743 605,736 496,013 646,750
Income taxes 240,367 218,101 238,236 198,866 261,427
Income before cumulative effect of a change
in accounting principle 395,552 353,642 367,500 297,147 385,323
Cumulative effect of a change in
accounting principle
—
19,541*395,090**
——
Net income (loss) after cumulative effect
of a change in accounting principle $395,552 $334,101 $ (27,590) $ 297,147 $ 385,323
Average common shares outstanding during year -
assuming dilution 175,660 174,480 175,104 173,633 175,327
Per common share:
Diluted net income, excluding cumulative effect $2.25 $2.03$2.10 $ 1.71*** $2.20
Diluted net income (loss) 2.25 1.91 (0.16) 1.71 2.20
Dividends declared declared 1.20 1.18 1.16 1.14 1.10
December 31 closing stock price 44.06 33.20 30.80 36.70 26.19
Long-term debt, less current maturities 500,000 625,108 674,796 835,580 770,581
Shareholders’ equity 2,544,377 2,312,283 2,130,009 2,345,123 2,260,806
Total assets $4,455,247 $4,127,956 $ 4,061,055 $ 4,206,646 $ 4,142,114